Contents area

Drought indices

Various indices are used to describe the current drought or wetness at selected stations in the MeteoSwiss monitoring network. The indices are derived from meteorological parameters. The most important input variable is precipitation amount, although some indices also take evaporation into account.

Footer

Top bar Navigation

Swiss federal authoritiesSwiss federal authorities

In Switzerland, an increase in drought can be seen for the period of 1981–2020, especially in the summer.  This is due on the one hand to a slight decrease in precipitation and on the other hand to increased evaporation caused by climate warming in recent decades. Both drought and wetness can be major stressors for plants, animals and humans. Natural ecosystems, as well as agriculture, forestry and power generation, are affected to varying degrees depending on the duration of the drought or wetness. It is therefore important to have access to continuously updated information about a possible lack or excess of precipitation, and to be aware of the moisture condition of the soil. MeteoSwiss provides a variety of drought indices for this purpose. The application below displays time series for these indices.

Precipitation and water balance anomaly

The three indices of SPI, water balance and SPEI show the deviations of precipitation amount or water balance from the long-term average over a given period of time.

Standardized Precipitation Index (SPI)

The SPI describes the extent to which the precipitation amount has deviated from the long-term average in the past month or over a longer period of time. By calculating the SPI over different time periods (1, 3, 6 and 12 months), the water deficit can be described for a range of time scales. This is very useful information, since the impacts of drought depend heavily on how long it lasts. For example, vegetation (and therefore agriculture) is sensitive to water deficits that continue for more than 1–3 months. The impacts on the water supply and power generation sectors generally come into play after longer periods of drought.
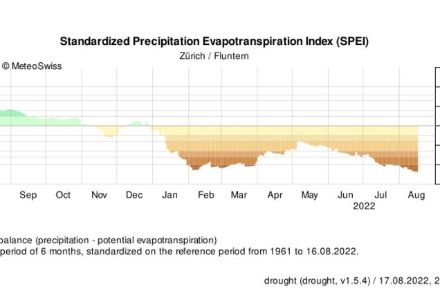
The water balance

The water balance is defined as the difference between precipitation amount and potential evapotranspiration. In this case, evapotranspiration is dependent exclusively on meteorological variables (temperature, humidity, wind and radiation). The water balance calculated from precipitation and potential evapotranspiration is therefore also called the meteorological water balance. A positive value indicates that more water fell as precipitation than evaporated into the atmosphere over the period in question. This is an absolute number, in contrast to the SPEI indicator (see below).

Evapotranspiration is a combination of evaporation of water through the leaves of plants (transpiration) and evaporation from all other surfaces. Transpiration depends on the condition and activity of plants. It varies according to the season, and it depends on both the density of the plant stock and the water supply to the vegetation, since plants can reduce water loss through their stomata when water is scarce.

Potential evapotranspiration is the evapotranspiration of a reference area of grassland that is optimally supplied with water. Since the vegetation parameters are precisely defined for this purpose, potential evapotranspiration depends purely on the atmospheric conditions. It is determined by temperature, solar radiation, humidity and wind speed.

Standardized Precipitation Evotranspiration Index (SPEI)

The SPEI describes the extent to which the water balance has deviated from the long-term average in the past month or over a longer period of time. It is a relative quantity: The water balance is expressed as the deviation from the long-term mean.

To calculate the SPI, the total precipitation of the entire data series within one calendar month is translated into the standard normal distribution around zero. The frequency with which a particular precipitation amount occurred in the corresponding month within the data series is then derived from the resulting values. For example, an SPI value of 1.64 or -1.64 is found to occur with a frequency of 5%, i.e. twice in 40 years or once in 20 years.

The SPEI is calculated in the same way as the SPI, but using the water balance instead of the precipitation total.

One advantage of standardization is that the water balances over different time periods can be ranked using the same index. A precipitation or water balance deficit of 30–40% can occur fairly frequently over a one-month period. To see the same deficit over an entire year, however, would be unusual. This is reflected in the SPI and SPEI indices.

The colours in the SPI and SPEI graphs correspond to the following categories:

Soil moisture indices

Soil moisture indices can be calculated with the help of a simple soil model. In this model, the soil is treated as a bucket: Precipitation fills the bucket, while evapotranspiration removes the water. The soil water balance is determined from day to day from the meteorological variables of precipitation and potential evapotranspiration. If the bucket is full (i.e. when the soil is saturated with water), precipitation does not soak into the soil, but runs off the surface. The model also takes into account the fact that, below a certain soil moisture level, the vegetation releases less water than it does when there is an optimal water supply. The actual evapotranspiration then depends on the soil moisture and is less than the potential evapotranspiration. To determine the storage capacity and transpiration levels of the vegetation, the model uses a soil with average properties and vegetation with grass (densely growing, and cut short).

Various different indices can be calculated using this model:

  • Soil moisture index: Soil moisture content of the model soil as a percentage
  • Soil water deficit: The precipitation amount in mm needed to saturate the soil with water
  • Plant water deficit: The precipitation amount in mm needed to achieve the optimal soil moisture for the vegetation

ARID (Agricultural Reference Index for Drought): Drought index that measures the deviation of the actual evapotranspiration from the potential evapotranspiration, thus describing the vegetation water deficit. This index is defined with a value of 0 for optimal water supply, and a value of 1 when there is no available water (1 – [actual evapotranspiration/potential evapotranspiration]).

Literature

  • Begert M., Schlegel T., Kirchhofer W., 2005: Homogeneous Temperature and Precipitation Series of Switzerland from 1864 to 2000. International Journal of Climatology 25: 65-80. http://onlinelibrary.wiley.com/doi/10.1002/joc.1118/pdf
  • Frei, C. and Schär C., 2001: Detection probability of trends in rare events: Theory and application to heavy precipitation in the Alpine region. J. Climate 14: 1568-1584. http://dx.doi.org/10.1175/1520-0442(2001)014<1568:DPOTIR>2.0.CO;2
  • Kendall M.G., 1975: Rank Correlation Methods, Charles Griffin, London.
  • Mann H.B., 1945: Nonparametric tests against trend. Econometrika 13:245-259.
  • Sen P.K., 1968: Estimates of the regression coefficient based on Kendall's tau. Journal of the American Statistical Association, 63, 1379-1389.
  • Theil H., 1950: A rank-invariant method of linear and polynomial regression analysis. Netherlands Akad. Wetensch. Proc., 53, pages: 386-392 (part I), 521-525 (part II), 1397-1412 (part III).
  • Scherrer SC, Hirschi M, Spirig C, Maurer F and Kotlarski S 2022: Trends and drivers of recent summer drying in Switzerland, Environ. Res. Commun., 4, 025004,
    https://doi.org/10.1088/2515-7620/ac4fb9