Service Navigation
Search
MeteoSwiss compiles climate data to record changes in the Earth’s energy and water cycles using the data provided by the European Meteosat weather satellites. To do this, MeteoSwiss works together with other European partners of the Satellite Application Facility for Climate Monitoring operated by the weather satellite organisation EUMETSAT. These high-quality satellite data sets are used by authorities, research institutes, universities and private enterprises in Switzerland.
Cloud cover
Since the 1980s, weather satellites have revolutionised the way clouds are recorded. They measure cloud cover over a wide area and perfectly complement the land-based measurements: Satellites record the upper cloud layers that cannot be monitored from the ground. Conversely, land-based stations provide data on the lower-lying clouds that are not visible to satellites as they are hidden under the higher cloud layers.
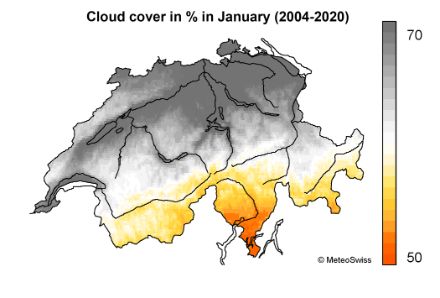

Average cloud cover over Switzerland, derived from Meteosat satellite data. Mean value of cloud cover as a percentage for 2004–2020 in January (left) and July (right).
The spatial distribution of cloud cover in Switzerland varies greatly depending on the season. In January, the sky on the Swiss plateau and over the large lakes is 70 percent overcast, while in the higher Alps, especially in Ticino and Valais, there are significantly fewer clouds (50 percent coverage). This is due to the pronounced areas of low stratus. In July, the greatest amount of cloud cover (up to 65 percent) is found in the mountains, as cumulus clouds often form in there during the course of the day. Low percentages of cloud cover are found in Ticino, the low-lying areas of the Rhône valley, and the western Swiss plateau.
Radiation on the Earth’s surface
Thanks to the measurements taken by the Meteosat satellite, the total radiation balance of the Earth’s surface in Switzerland can be ascertained for every single hour dating back to the 1980s. The radiation balance is the difference between the radiation fluxes that the Earth receives from the sun in the form of short-wave radiation (solar radiation) and then radiates back into space in the form of long-wave thermal radiation. From satellite measurements, MeteoSwiss is able to generate radiation data on all aspects of the radiation balance of the Earth’s surface. The solar radiation component is of particular importance for solar electricity and solar heat generation.
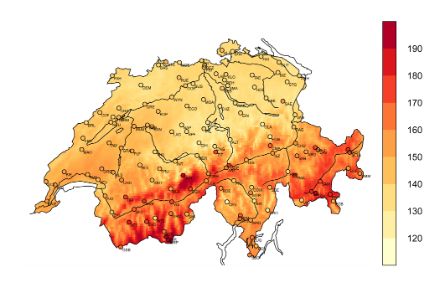
The definition of solar radiation is the total short-wave radiation that strikes the Earth’s surface on a horizontal plane. The annual average solar radiation in the Alps is 170–190 W/m2, which is equal to an annual cumulative energy volume of around 1600 kWh/m2. The Swiss plateau receives significantly less solar radiation at 140–160 W/m2. The reasons for this are winter fog, increased atmospheric turbidity and the lack of snow to reflect radiation back into space.
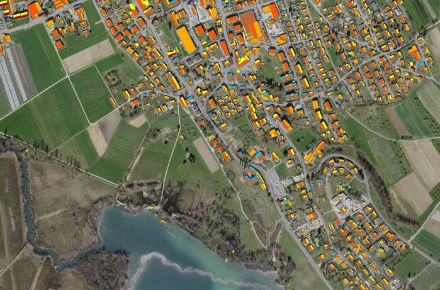
As part of the federal government’s Energy Strategy 2050, the interactive application sonnendach.ch, a joint project between the Swiss Federal Office of Energy, the Federal Office of Topography Swisstopo and MeteoSwiss, was created for all properties in Switzerland. The website provides an analysis of the solar potential of all buildings in Switzerland based on solar radiation data from satellites. With just a few clicks of the mouse, every person in Switzerland can estimate whether the roof or façade of their building is suitable for producing solar electricity and solar heat.
Surface temperature and drought
Satellites measure the temperature of the outermost layer of the Earth. MeteoSwiss has developed special algorithms that can ascertain, with an accuracy of about one degree, the surface temperature from Meteosat satellite measurements dating all the way back to the 1990s. When surface temperature data are combined with vegetation data, the climatological vegetation health index (VHI) can be calculated.
This makes it possible to forecast whether and how drought will develop, which is important for agriculture, forestry and energy management. Since vegetation data are not available from old Meteosat measurements, MeteoSwiss combines Meteosat surface temperature data with satellite-based vegetation data from the United States National Oceanic and Atmospheric Administration (NOAA).
The VHI drought index shows how hot the Earth’s surface was and how brown the vegetation of Switzerland was compared to the normal period of 1991–2020. These data can be used to visualise drought in Switzerland since 1991. Dry soil is significantly warmer than wet soil, and the vegetation considerably browner. 2003, 2015 and 2018 were significantly drier compared to the normal period of 1991–2020. 2003 was the first year since 1991 in which the whole of Switzerland was affected by drought. In 2015 and 2018, the Swiss plateau in particular was very dry.