Service Navigation
Search

Four key messages are used to explain climate change:
- Climate change is real, and we know what is occurring.
- Humans are causing almost all of the current changes.
- Climate change predominantly poses risks. Switzerland is also severely affected by these risks.
- The direst consequences can be prevented by taking decisive action on a global scale.
It is an undisputed fact that the Earth has been getting considerably warmer since industrialisation, and that the climate has changed significantly, both globally and in Switzerland. The current global climate mean is already 1.3 °C above the pre-industrial average of 1871-1900, in Switzerland the increase is even 2.9 °C. The global temperature is now higher than it has ever been in the last 2,000 years, and most probably even in the last 125,000 years.
Observed global climate change
The decade of 2011–2020 was already 1.1°C warmer globally than the pre-industrial mean temperature for the period of 1850–1900. Breaking that figure down further, the temperature increase over land of around 1.6°C was much greater than the 0.9°C increase over the oceans. Furthermore, the warming is particularly pronounced in the high latitudes of the northern hemisphere (see link below). The temperature rise has accelerated considerably since the 1960s. The years 2015 to 2025 were the warmest since measurements began. After 2024 and 2023, 2025 is the third warmest year, with temperatures almost 1.5 °C above the pre-industrial average for 1850–1900. There are many other changes occurring that are connected to warming. These range from extreme weather events, changes in the hydrological cycle and melting ice masses, to rising sea levels, changes in ocean currents and ocean acidification.
Observed climate change in Switzerland
The climate has undergone substantial change in Switzerland, as can be seen from the developments in temperature, water balance and weather extremes.
Temperature
The temperature in Switzerland has risen sharply since measurements began (see table in slideshow below). The current climate mean is already 3.0 °C above the pre-industrial average of 1871-1900 (as of 2026). The average for the last ten years (2016–2025) is 2.8 °C above the average of 1871–1900. Since the 1960s, every decade has been warmer than the previous one. Moreover, the nine warmest years were all measured after 2010. 2022, 2023 and 2024 were clearly the warmest years with a deviation of 3.6, 3.4 and 3.3 °C respectively from the pre-industrial mean of 1871-1900, followed by 2025. The four coldest years in Switzerland all occurred before 1900. Warming in Switzerland has long been twice as strong as the global average (see infobox "Why is Switzerland warming more than the global average?" below).

There are two main effects that readily explain the difference between the mean global warming and the warming over Switzerland. One of these is that the warming which has been taking place over land – 1.6°C compared to pre-industrial times – is much greater than it is over the oceans. Water masses absorb much of the extra heat and conduct it into the deeper ocean levels. Conversely, land masses do not store heat as effectively, which leaves more energy available for warming the air. In addition, since there is an unlimited amount of water available, much of the extra heat over the oceans is used in evaporation, which is not the case on land. The second effect is that warming increases towards the pole in the northern hemisphere. The decline in snow and ice cover, which leads to greater absorption of solar radiation, is likely to play an important role here, along with increased heat transport towards the pole. Since Switzerland is part of the land mass in the central northern latitudes, it is also subject to the second effect. Climate scenarios show that in the future, Switzerland will continue to warm faster than the global average. This is explained in more detail in the Climate CH2025 brochure.

Glacial, snow and vegetation developments
The strong warming has an impact on many other climate indices in Switzerland. For instance, the zero degree line has climbed substantially, which has resulted in Alpine glaciers losing about 65 percent of their volume since 1850. It is likely that they will no longer be part of the Alpine landscape by the end of this century. The vegetation period now lasts several weeks longer in the lowlands than it did even in the 1960s. Due to warming, precipitation now falls more often as rain than snow. The number of snow days has reduced considerably, especially in low-lying areas. Winter precipitation, on the other hand, has increased in the last 150 years or more. The sunshine duration reduced between 1950 and 1980, but has been on the increase again since 1980.

Other weather extremes
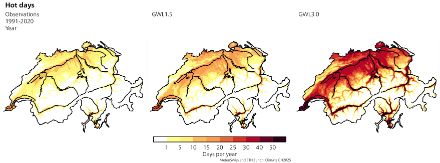
Global climate change is also resulting in more extreme weather in Switzerland. Heat waves have significantly increased in frequency and intensity, while cold periods are occurring much less frequently. The number of frost days and ice days is declining, and frozen lakes are almost a thing of the past when it comes to the larger lakes. Heavy precipitation events are much more frequent and intense today than they were at the start of the 20th century. The principle underlying this has been well understood for over 150 years: Warm air is able to absorb a greater amount of moisture, which leads to heavier rainfall. Climate models have been predicting these changes for several decades already. Summers have become significantly drier in recent decades. The reason for this is less rain and at the same time higher evaporation due to the strong warming.
The influence of climate change is clear as far as many weather parameters are concerned. However, changes in localised processes and extremes such as fog, Foehn and other local winds, storm cells, tornadoes or hail are more difficult to explain. At present, it is only possible to make partial statements about changes for such variables. The reasons for this are short observation periods, large natural variability or that they cannot yet be adequately captured by current climate models. However, the observation datasets are constantly improving, and climate models are improving all the time and becoming more high-resolution. We therefore expect to be in a better position in the future to answer these outstanding questions.
An overview of current knowledge about past and future changes in selected weather and climate phenomena can be found here:
Humans are causing almost all of the current changes
Nowadays, the mechanisms of the climate system are well understood. The greenhouse effect plays a central role. Due to human-induced emissions of greenhouse gases, the natural greenhouse effect is intensified and additional heat is directed towards the Earth’s surface. Almost all of the total observed warming since industrialisation began is attributable to human activity.
The natural greenhouse effect
The Earth’s weather and climate are driven by incoming solar radiation. Around half the radiation is absorbed by the Earth’s surface, which then heats up. A further 20 percent is absorbed by the atmosphere, which also warms. Thirty percent is reflected back into space and is lost. It is essential for life on Earth that the heat radiated by the Earth’s surface does not immediately leave the atmosphere. Greenhouse gases such as water vapour, carbon dioxide, methane and nitrous oxide absorb the heat radiation and, in turn, radiate them back again. Thanks to this greenhouse effect (german), the global mean temperature in the lower atmosphere increases by around 32°C, from -18 to +14°C. This is what makes the Earth inhabitable. We have known about these relationships for over 150 years and verified them through experiments and observations.
Humans are intensifying the greenhouse effect
Since the beginning of industrialisation in the 19th century, there have been substantial increases in atmospheric greenhouse gases as a result of human activity. The main culprits are the combustion of coal, oil and natural gas, intensive agriculture, the loss of large areas of forest and moorland, and changes in land use. For instance, in the last 150 years or so, the carbon dioxide content of the atmosphere has increased by almost 50 percent, from around 280 ppm (CO2 particles per million air molecules) to 428 ppm (as of January 2026). This is the highest CO2 content our atmosphere has seen in the last two million years.
Because human activity is intensifying the greenhouse effect, there is additional heat in the overall climate system. The majority of this heat is accumulating in the oceans and warming them. Only around one to two percent remains in and warms the atmosphere. Almost all of the total observed warming since industrialisation began is attributable to human activity. Solar and volcanic activity and internal fluctuations in the climate system play only a very minor role. These findings are partly based on simulations using climate models that have been adept at capturing the interactions between basic physical laws for several decades.
The climate has changed in many ways over the course of the Earth’s multimillion-year history. The main reasons for these changes are generally well understood by scientists. Throughout the Earth’s history, warm periods with high concentrations of greenhouse gases, and cold periods (ice ages) with low concentrations were caused primarily by changes in the Earth’s orbit around the sun or in the Earth’s axis of rotation, as well as by the shifting of continents. However, the changes caused by the above factors occurred much more slowly compared to the warming we are seeing today, and can therefore be ruled out as a cause of the rapid rate of warming over the last 150 years or so. Neither do changes in solar and volcanic activity explain today’s climate change.
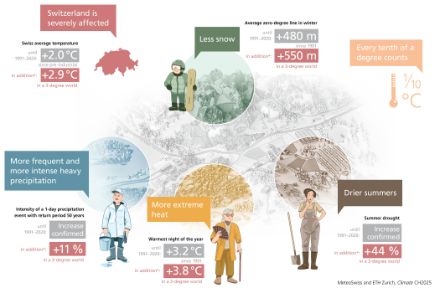
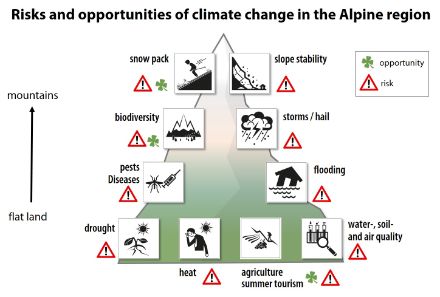
Climate change predominantly poses risks, and Switzerland is strongly affected
Continued climate change will have more negative than positive consequences. Switzerland is threatened by more extreme weather with drier summers, heavier precipitation, greater numbers of hot days, and winters with little snow. Mountain regions are likely to be subject to additional risks such as rockfalls and debris flows, as well as loss of biodiversity.
Alongside global warming, climate change is having numerous other direct, global consequences, including changes in the hydrological cycle, more extreme weather, melting of ice masses, rising sea levels, changing ocean currents, and ocean acidification.
Swiss Climate Change Scenarios
MeteoSwiss works together with its research partners to produce national Climate Change Scenarios for Switzerland. The Climate CH2025 climate scenarios form a central basis for the Federal Council's adaptation strategy. They indicate how and in which regions climate change is having an impact, and provide a more accurate picture of Switzerland’s future climate. The climate scenarios show how vulnerable Switzerland is to the effects of global warming. They also clearly demonstrate what we have to gain from decisive and consistent climate protection at regional, national and international levels.
The Climate scenarios show that the changes observed to date will continue in the future and that Switzerland will continue to warm faster than the global average. Future climate change can be summarised in four main statements:
- More extreme heat: Extreme heat is becoming more frequent and more intense
- Drier summers: Soils in Switzerland are drying out increasingly in summer
- More frequent and more intense heavy precipitation: Heavy precipitation is becoming more frequent and more intense
- Less snow: Precipitation will fall more often as rain instead of snow
Impacts of climate change in Switzerland
Climate change in Switzerland has major implications for the environment, society and the economy. The risks clearly outweigh the opportunities and affect almost every facet of life. Several risks, particularly heat, natural hazards and disease, affect the health of the population. Mountain regions are especially vulnerable, with the threat of additional risks from deteriorating slope stability, and increased landslides, debris flows and rockfalls. Biodiversity will also be affected by climate change, particularly at higher altitudes. Climate change does present certain opportunities for energy production in winter, reductions in snow damage, income from summer tourism, and also possibly from agriculture.
Worse consequences can be prevented by taking decisive action on a global scale
The impacts of climate change are already being experienced, calling for adaptation measures. The extent to which the Earth will warm and how severe the consequences will be depends primarily on the amount of greenhouse gases emitted globally. Rapid and concerted efforts to reduce these emissions can prevent the gravest consequences from becoming a reality.
Political consensus on restricting climate warming
At the Paris climate summit in 2015, the global community adopted an agreement committing all nations to reducing greenhouse gases. The goal of the Agreement is to limit global warming to well below 2°C, and preferably to 1.5°C, compared to pre-industrial levels. Switzerland has also ratified the Agreement, and is committed to a rapid and significant reduction in its greenhouse gas emissions. The aim is to reduce emissions by 50 percent compared to 1990 levels by 2030. This will require taking action in almost every sector, including transport, construction, industry, agriculture, services and waste management. A net zero target has been set for 2050, after which time no more greenhouse gases should enter the atmosphere than are removed via natural sinks and technological methods.
Climate change mitigation works, but adaptation measures will also be necessary
The extent of the impacts of climate change is a direct consequence of global temperature rise and depends entirely on global emissions. With ambitious climate mitigation measures and global net-zero emissions by 2050, most long-term warming and many of the resulting impacts could be avoided.
Recent data indicate that global warming of 1.5 °C will be reached within a few years. The effects of climate change are already visible and will intensify in the future. Every fraction of a degree avoided contributes measurably to climate protection and reduces the adaptation efforts required. Nevertheless, adaptation to climate change is becoming increasingly important. Switzerland has had a climate change adaptation strategy since 2012, which is regularly revised to incorporate the latest findings. The new climate scenarios from Climate CH2025 will provide an important basis for the next revision of the adaptation strategy. This strategy supports policymakers and society in reducing risks and making climate-adapted decisions.