Service Navigation
Search
The observational network of MeteoSwiss monitors weather and climate at a large number of stations. For many applications, however, climate information is required at high spatial density or at locations without direct measurements. MeteoSwiss responds to these needs with an extensive set of analysis datasets, which are calculations of near-surface climate variables on a high-resolution grid over Switzerland or the entire Alpine region.
Spatial climate analyses integrate data from various observation sources (weather stations, radar and satellite) on the basis of expert knowledge about the distribution of climate. For the development of the underlying statistical methods, MeteoSwiss works in partnerships with the research community, other weather services, and with users of the datasets.
Selected climate datasets can be readily viewed as maps on the website of MeteoSwiss. You can take a journey through the climate of the past decades, in maps, month by month, back to 1981:
Overview of datasets
The compilation of datasets encompasses analyses for precipitation, temperature, sunshine duration, radiation and clouds. The analyses are available on a grid of 1, 2, or 5 kilometres, depending on the dataset. For a set of core variables the datasets range back to at least 1971, at daily, monthly and annual time resolution. They are also available as normals (averages) for the period 1991-2020. In addition, there is an hourly precipitation analysis, available back to 2005 that relies on a combination of radar and station data. Datasets for radiation, land surface temperature and cloud cover are derived from high-resolution satellite data. They range back to 1991. For long-term climate monitoring, there exists a continuous series of monthly temperature and precipitation analyses beginning with the regular meteorological measurements in 1864. With a few exceptions, all datasets are regularly updated.
Datasets in detail
The choice of a suitable dataset for an application crucially depends on the requirements of the application. Apart from technical criteria (required time period and resolution), aspects of data quality are essential. If it is important that the analysis represents fine-scale detail appropriately, a product should be chosen that integrates as many observations as possible. If, however, the application requires a high consistency over time, a data product that was compiled only from homogenous and uninterrupted measurement series should be chosen. For this reason, the palette of available datasets is broad and an appropriate data selection implies that users carefully reflect on the potential and limitations of the different products. For this purpose, detailed documentations have been written for the data products (in English only). The following tables list the available datasets and link to the product documentations available online.
| Acronym | Beschreibung/Description/Descrizione/Description |
|---|---|
| RnormY9120 | Mean yearly precipitation (norm value, 1991-2020) |
| RnormM9120 | Mean monthly precipitation (norm value, 1991-2020) |
| R9120m6190Y | Ratio in yearly precipitation norm values (1991-2020 / 1961-1990) |
| R9120m6190M | Ratio in monthly precipitation norm values (1991-2020 / 1961-1990) |
| RhiresY | Yearly precipitation (1961 – present) |
| RrecabsYNNNN | Yearly precipitation (long-term consistent since NNNN=1864, 1901, 1961) |
| RanomY9120 | Yearly precipitation anomaly (relative to 1991-2020, 1961 – present) |
| Rrecanom9120YNNNN | Yearly precip anomaly (relative to 1991-2020, long-term consistent since NNNN=1864, 1901, 1961) |
| Rrecanom6190YNNNN | Yearly precip anomaly (relative to 1961-1990, long-term consistent since NNNN=1864, 1901, 1961) |
| RhiresM | Monthly precipitation (1961 – present) |
| RrecabsMNNNN | Monthly precipitation (long-term consistent since NNNN=1864, 1901, 1961) |
| RanomM9120 | Monthly precipitation anomaly (relative to 1991-2020, 1961 – present) |
| Rrecanom9120MNNNN | Monthly precip anomaly (relative to 1991-2020, long-term since NNNN=1864, 1901, 1961) |
| Rrecanom6190MNNNN | Monthly precip anomaly (relative to 1961-1990, long-term since NNNN=1864, 1901, 1961) |
| RhydchprobD | Daily precipitation (ensemble analysis for hydrological units, 1961 – present) |
| RwarnchprobD | Daily precipitation (ensemble analysis for warn regions, 1961 – present) |
| RhiresD | Daily precipitation (final analysis, 1961 – last month) |
| RprelimD | Daily precipitation (preliminary analysis, for past two months) |
| APGD | Daily precipitation over the Alpine Region (1971-2019) |
| APGDEns | Daily precipitation ensemble dataset over the Alpine Region (1971-2008) |
| CPC | Hourly precipitation from radar and stations (real-time analysis, 2005-present) |
| Acronym | Beschreibung/Description/Descrizione/Description |
|---|---|
| TnormY9120 | Mean yearly mean temperature (norm, 1991-2020) |
| T9120m6190Y | Difference in mean yearly temperature norm (1991-2020 – 1961-1990) |
| TminnormY9120 | Mean yearly daily minimum temperature (norm, 1991-2020) |
| TmaxnormY9120 | Mean yearly daily maximum temperature (norm, 1991-2020) |
| TnormM9120 | Mean monthly mean temperature (norm, 1991-2020) |
| T9120m6190M | Difference in mean monthly temperature norm (1991-2020 – 1961-1990) |
| TminnormM9120 | Mean monthly daily minimum temperature (norm, 1991-2020) |
| TmaxnormM9120 | Mean monthly daily maximum temperature (norm, 1991-2020) |
| TnormD9120 | Mean calendar day temperature (norm, 1991-2020) |
| TabsY | Yearly mean temperature (1961 – present) |
| TrecabsYNNNN | Yearly temperature (long-term consistent since NNNN=1864, 1901, 1961) |
| TmaxrecabsYNNNN | Yearly maximum temperature (long-term consistent since NNNN=1901, 1961) |
| TminrecabsYNNNN | Yearly minimum temperature (long-term consistent since NNNN=1901, 1961) |
| TanomY9120 | Yearly temperature anomaly (relative to 1991-2020, >1961 – present) |
| Trecanom9120YNNNN | Yearly temp. anomaly (relative to 1991-2020, long-term consistent since NNNN=1864, 1901, 1961) |
| Trecanom6190YNNNN | Yearly temp. anomaly (relative to 1961-1990, long-term consistent since NNNN=1864, 1901, 1961) |
| Tmaxrecanom9120YNNNN | Yearly maximum temp. anomaly (long-term consistent since NNNN=1901,1961) |
| Tminrecanom9120YNNNN | Yearly minimum temp. anomaly (long-term consistent since NNNN=1901,1961) |
| TminY | Yearly mean of daily minimum temperature (1961 – present) |
| TmaxY | Yearly mean of daily maximum temperature (1961 – present) |
| TabsM | Monthly mean temperature (1961 – present) |
| TrecabsMNNNN | Monthly temperature (long-term consistent since NNNN=1864, 1901, 1961) |
| TmaxrecabsMNNNN | Monthly maximum temperature (long-term consistent since NNNN=1901, 1961) |
| TminrecabsMNNNN | Monthly minimum temperature (long-term consistent since NNNN=1901, 1961) |
| TanomM9120 | Monthly temperature anomaly (relative to 1991-2020, 1961 – present) |
| Trecanom9120MNNNN | Monthly temp. anomaly (relative to 1991-2020, long-term consistent since NNNN=1864, 1901, 1961) |
| Trecanom6190MNNNN | Monthly temp. anomaly (relative to 1961-1990, long-term consistent since NNNN=1864, 1901, 1961) |
| Tmaxrecanom9120MNNNN | Monthly maximum temp. anomaly (long-term consistent since NNNN=1901, 1961) |
| Tminrecanom9120MNNNN | Monthly minimum temp. anomaly (long-term consistent since NNNN=1901, 1961) |
| TminM | Monthly mean of daily minimum temperature (1961 – present) |
| TmaxM | Monthly mean of daily maximum temperature (1961 – present) |
| TabsD | Daily mean temperature (1961 – present) |
| TanomD9120 | Daily mean temperature anomaly (relative to 1991-2020, 1961 – present) |
| TminD | Daily minimum temperature (1961 – present) |
| TmaxD | Daily maximum temperature (1961 – present) |
| TabsH | Hourly mean temperature (2018 – 2024) |
| Akronym | Beschreibung/Description/Descrizione/Description |
|---|---|
| LST_PMW | Hourly land surface (skin) temperature (1991 – present) calculated from satellite observations |
| Acronym | Beschreibung/Description/Descrizione/Description |
|---|---|
| SnormY9120 | Mean yearly relative sunshine duration (norm, 1991-2020) |
| S9120m6190Y | Ratio in mean yearly sunshine duration. (1991-2020 / 1961-1990) |
| SnormM9120 | Mean monthly relative sunshine duration (norm, 1991-2020) |
| S9120m6190M | Ratio in mean monthly sunshine duration. (1991-2020 / 1961-1990) |
| SrelY | Yearly relative sunshine duration (1961 – present) |
| SrelrecYNNNN | Yearly relative sunshine duration (long-term consistent since NNNN=1901, 1961) |
| SanomY9120 | Yearly sunshine duration anomaly (relative to 1991-2020, 1961 – present) |
| Srecanom9120YNNNN | Yearly sunshine duration anomaly (relative to 1991-2020, long-term consistent since NNNN=1901, 1961) |
| Srecanom6190YNNNN | Yearly sunshine duration anomaly (relative to 1961-1990, long-term consistent since NNNN=1901, 1961) |
| SrelM | Monthly relative sunshine duration (1961 – present) |
| SrelrecMNNNN | Monthly relative sunshine duration (long-term consistent since NNNN=1901, 1961) |
| SanomM9120 | Monthly sunshine duration anomaly (relative to 1991-2020, 1961 – present) |
| Srecanom9120MNNNN | Monthly sunshine duration anomaly (relative to 1991-2020, long-term consistent since NNNN=1901, 1961) |
| Srecanom6190MNNNN | Monthly sunshine duration anomaly (relative to 1961-1990, long-term consistent since NNNN=1901, 1961) |
| SrelD | Daily relative sunshine duration (1961 – present) |
| Akronym | Beschreibung/Description/Descrizione/Description |
|---|---|
| ALB | Hourly, Daily, Monthly and Yearly Albedo (1991 – present) calculated from satellite observations |
| SIS | Hourly, Daily, Monthly and Yearly Surface incoming solar radiation (1991 – present) with and without horizon calculated from satellite observations |
| SISCF | Hourly, Daily, Monthly and Yearly Clear sky surface incoming solar radiation (1991 – present) with and without horizon calculated from satellite observations |
| SISDIF | Hourly Diffuse surface incoming solar radiation (1991 – present) with and without horizon calculated from satellite observations |
| SISDIR | Hourly, Daily, Monthly and Yearly Direct surface incoming solar radiation (1991 – present) with and without horizon calculated from satellite observations |
| SISDIRCF | Hourly, Daily, Monthly and Yearly Clear-sky direct surface incoming solar radiation (2004 – present) with and without horizon calculated from satellite observations |
| SISDNI | Hourly Direct normal surface incoming solar radiation (2004 – present) with and without horizon calculated from satellite observations |
| KI | Hourly Cloud Index (2004 – present) calculated from satellite observations |
| SDL | Hourly, Daily, Monthly and Yearly Surface downward longwave radiation (1991 – present) calculated from satellite observations |
| SOL | Hourly, Daily, Monthly and Yearly Surface outgoing longwave radiation (1991 – present) calculated from satellite observations |
| NSR | Hourly, Daily, Monthly and Yearly Net Shortwave Radiation (1991 – present) calculated from satellite observations |
| NLR | Hourly, Daily, Monthly and Yearly Net Longwave adiation calculated from satellite observations |
| SRB | Hourly, Daily, Monthly and Yearly Surface Radiation Budget (1991 – present) calculated from satellite observations |
| BB_EM | Daily Broad-band emissivity <Link auf ProdDoc_Radiation.pdf (1991 – present) calculated from satellite observations |
| Akronym | Beschreibung/Description/Descrizione/Description |
|---|---|
| CMASK | Hourly Cloud Mask (2004 – present) calculated from satellite observations |
| CFC | Hourly, Daily, Monthly and Yearly Cloud Fractional Cover (1991 – present) calculated from satellite observations |
| CTH | Hourly Cloud Top Hight (1991 – present) calculated from satellite observations |
| CTT | Hourly Cloud Top Temperature (1991 – present) calculated from satellite observations |
Grid data for climate normals
Spatial analyses of averages of precipitation, air temperature (mean, mean minimum and mean maximum), radiation, clouds and sunshine duration over the actual norm period 1991-2020 can be downloaded free of charge:
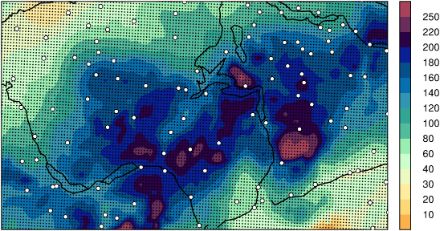
Precipitation datasets for the entire Alpine region
MeteoSwiss also provides spatial analyses of precipitation for the entire Alpine region. This includes a high-resolution grid for daily precipitation (APGD, Alpine Precipitation Grid Dataset) over the period 1971-2019, based on more than 8500 measuring stations. A probabilistic precipitation analysis (APGDEns)) was also developed with the same measurement data. Finally, a reconstruction of monthly precipitation back to 1871 is available (LAPrec, Long-term Alpine Precipitation Reconstruction). It is calculated in cooperation with the Austrian meteorological service ZAMG and is based on the HISTALP dataset.
Climate at a user-defined location
Instead of grid points, MeteoSwiss can also provide climate data at any location in Switzerland. Let us know the coordinates and elevations of your desired location. We then calculate the respective climate time series for the following parameters: Precipitation, temperature, radiation and sunshine duration. For the sunshine duration, both the relative values (sunshine in relation to the maximum possible sunshine duration) and the absolute values (duration in minutes) can be calculated. An individual offer can be obtained from the customer service.
Energy indicators by postcode and for various institutional levels
Energy indicators such as heating degree days (HDD) and cooling degree days (CDD) are provided by MeteoSwiss both as analyses by postcode and by polygons of the institutional levels of Switzerland and Liechtenstein (municipalities, districts, cantons and entire country). Various time aggregations are available (daily, monthly, seasonal, annual and others).
Uncertainties
Estimates of a climate variable at locations with no direct measurement are subject to uncertainties. Their relevance for an application depends on the respective requirements. It is therefore important that users assess the potential consequences prior to formal application. Indications and summary measures on analysis uncertainty are described in the product documentations. The newly established ensemble analyses (available for precipitation only so far) allow users to track uncertainties through applications in a fully quantitative manner. General implications of and recommendations on dealing with uncertainties in spatial climate datasets are summarized in a DACH Workshop Document.
Renovations
The spatial climate datasets of MeteoSwiss are continuously developed further. Recently, the widely-used precipitation analyses have been extended to cover a larger domain, including areas close to the border outside the country. Information about these recent developments and the upcoming change in the delivery format is provided in our newsletter. Some example datasets in the new format illustrate the technical changes.
zip-file containing the following files:
- New Swiss coordinate system LV95 - CH1903+
- Extended analysis domain for RhiresD and RprelimD v2.0 (Swiss coordinates)
- Extended analysis domain for RhiresD and RprelimD v2.0 (lonlat coordinates)
- Climatological time axis for norm values
Advice and data delivery
Do you have questions on the availability of spatial climate analysis and their utility for a specific application? PLease don’t hesitate to contact an expert at MeteoSwiss for advice. The costs for the data depend on data volume and intended use. We are happy to make an individual offer. The data can be supplied in various formats (NetCDF, GeoTIFF und ASCII), as one-time delivery or on a regular basis with the most recent data.