Contents area

Norm value charts

The maps of normal values show the long-time averages for temperature, precipitation, sunshine duration and various climate indictors in Switzerland. Several normal periods as well as their differences are illustrated. The spatial illustration is based on a 2 km grid point data set, calculated using all available measurements from ground-based measuring stations.

Footer

Top bar Navigation

Swiss federal authoritiesSwiss federal authorities

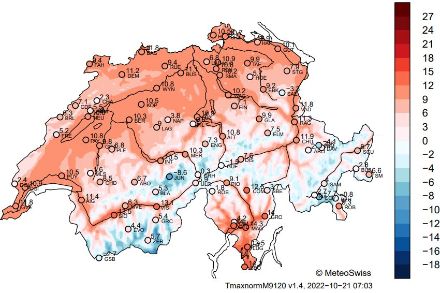
Spatial Climate Analyses

The analysis is based on spatial climate analyses (grid spacing 2 kilometres), which are calculated from measurements at surface stations. The analyses can be obtained from MeteoSwiss in different temporal and spatial resolutions, depending on the parameter.