Service Navigation
Search
The figure below shows the hyetographs for five stations measuring hourly precipitation that are located in the Jura mountains (Bullet/La Frétaz, Chasseral, La Chaux-de-Fonds and La Dôle) and on the eastern Alpine north slope (Säntis), as well as for five other stations located on the western Alpine north slope (Adelboden, Grimsel Hospiz, Interlaken, Le Moléson) and on the Plateau (Wynau). Unfortunately, no station measuring hourly precipitation was located in the Vaud Alps at the time of the event and only daily precipitation is available in that region (see table further below).
Out of these ten stations, the station that measured the largest precipitation sum between 10 and 15 February is station Säntis, with 384 mm in 6 days. At stations located in the Jura mountains and for the same time lapse, 287.3 mm of precipitation was measured at La Dôle, 218.6 mm at Bullet/La Frétaz, 174.9 mm at Chasseral and 164.9 mm at La Chaux-de-Fonds. Other large 6-day sums were measured during the event in the Bernese Oberland (e.g. Adelboden: 189.3 mm; Grimsel Hospiz: 179.2 mm; Interlaken: 169.4 mm), in the Fribourg Prealps (e.g. Le Moléson: 158.2 mm), as well as on the Plateau (e.g. Wynau: 155.6 mm).
At all ten stations, the event started with intermittent precipitation between 10 and 13 February, with sometimes relatively high hourly intensity (e.g. maximum of 9.1 mm/h at Grimsel Hospiz and 7.2 mm/h at Bullet/La Frétaz). During that time, the snow line was located at lower altitude than eight of these stations (approx. 700m, see section Precipitation and temperature) and they received fresh snow, while the two remaining stations located at lower altitude (Interlaken and Wynau) measured rainfall.
During the afternoon and evening of 13 February, the precipitation intensity increased and relatively large amounts of precipitation fell until the afternoon of 15 February. The highest hourly intensity was measured at station Säntis (max. 9.6 mm/h), while in the Jura slightly lower intensities were measured (e.g. 6.8 mm/h at station La Dôle and 6.5 mm at station Bullet/La Frétaz). This high precipitation intensity coincided with an increase in temperature, which caused the elevation of the snow line to an altitude of approximatively 1700m and the areas located below that altitude to receive intense rainfall instead of snowfall. In low elevated areas, on the other hand, temperatures during the event remained above 0°C and the stations located in those regions only recorded rainfall.
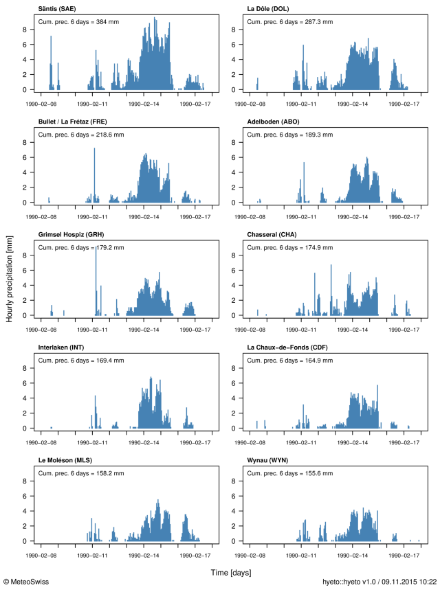
The hyetographs display hourly precipitation starting 2 days before the beginning of the event (8 February 1990) and ending 2 days after the end of the event (17 February 1990). The hourly precipitation [mm] is represented by the vertical blue bars and the date is given on the time axis, where each day begins at 00 UTC. The cumulated precipitation over the duration of the event (6 days) is indicated in the top left corner of the plots and corresponds to the precipitation measured between 10 February 1990, 05:40 UTC and 16 February 1990, 05:40 UTC.
Comparison with other heavy precipitation events
The plots in the infoboxes below show the event of 10-15 February 1990 compared with other events for stations La Dôle and Säntis. At both stations, the precipitation event of 10-15 February not only brought the largest 120-hour precipitation sum measured in winter between 1981 and 2014, but also all seasons considered (respectively 285.8 mm and 383.6 mm). However, when considering a longer time lapse, larger 120-hour sums have been measured before. For example, station La Dôle measured 302.5 mm/120h in February 1980, while station Säntis recorded 418.2 mm/120h in November 1921.
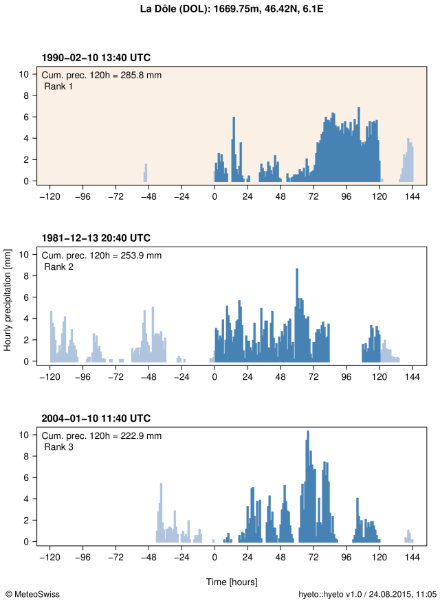
Comparison of the event (beige background) with two other large 120-hour precipitation sums (white background) that were measured at station La Dôle (Jura) in winter (DJF) between 1981 and 2014. The hourly precipitation [mm] is represented by vertical bars: blue during, and grey before and after the 120-hour intervals. The dates and times corresponding to the beginning of the 120-hour intervals are given above the plots and indicated by 0 on the time axis. The rank indicates the ranking of the events compared to other 120-hour precipitation sums at that station.
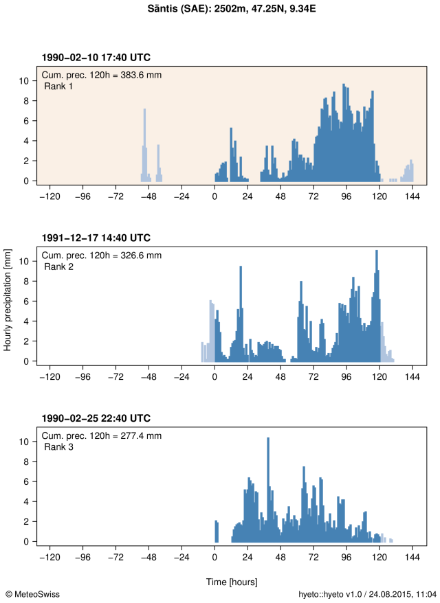
Comparison of the event (beige background) with two other large 120-hour precipitation sums (white background) that were measured at station Säntis (eastern Alpine north slope) in winter (DJF) between 1981 and 2014. The hourly precipitation [mm] is represented by vertical bars: blue during, and grey before and after the 120-hour intervals. The dates and times corresponding to the beginning of the 120-hour intervals are given above the plots and indicated by 0 on the time axis. The rank indicates the ranking of the events compared to other 120-hour precipitation sums at that station.
Moving sums of hourly precipitation cumulated over a duration interval of 120 hours are used in order to determine the highest 120-hour precipitation sums at the given stations and to determine the ranking of the event of February 1990 compared to other precipitation sums of same duration for the same season (DJF). A large 120-hour precipitation sum does not always result from one long-lasting precipitation event, but can also result from two precipitation events separated by a certain amount of hours. Note that the starting time of the duration interval over which the cumulated precipitation is the highest can differ from one station to another.
Automatic stations measuring hourly precipitation were used to produce the hyetographs presented above. Other stations measuring daily precipitation are also located in the affected area, at which large precipitation amounts were also measured during the event. The tables in the boxes below show the daily precipitation for some of these stations, as well as the maximum 5-day precipitation sum between 10 and 15 February 1990. The latter can be used to compare the precipitation amounts recorded during the event with those presented above (120-hour precipitation).
| Date | CUE | MGL | CHB | COU |
|---|---|---|---|---|
10.02.1990 | 22.2 | 21.5 | 12.9 | 17.9 |
11.02.1990 | 11.2 | 19 | 12 | 9 |
12.02.1990 | 17.9 | 18.5 | 16.5 | 7.7 |
13.02.1990 | 109.3 | 72 | 71.7 | 78.7 |
14.02.1990 | 131.3 | 81 | 92.8 | 99.1 |
15.02.1990 | 37.6 | 24 | 20 | 16.5 |
Max 5-day sum | 307.3 | 214.5 | 213 | 212.4 |
Daily precipitation during the event and maximum 5-day precipitation sum between 10 and 15 February 1990 (both in mm) at stations located in the Jura mountains: La Cure (CUE), Magglingen (MGL), Les Charbonnières (CHB) and Couvet (COU). The sum is always calculated from 05:40 UTC of a given day to 05:40 UTC of the following day. Source: MeteoSwiss
| Date | CDM | CHD | AIG |
|---|---|---|---|
10.02.1990 | 25.4 | 16.4 | 11.6 |
11.02.1990 | 18.1 | 8.9 | 5 |
12.02.1990 | 6.4 | 4 | 1.3 |
13.02.1990 | 97.2 | 40.8 | 26.1 |
14.02.1990 | 174 | 51 | 45.4 |
15.02.1990 | 63.8 | 17.5 | 17.8 |
Max 5-day sum | 359.5 | 122.2 | 95.6 |
Daily precipitation during the event and maximum 5-day precipitation sum between 10 and 15 February 1990 (both in mm) at stations located in the region of the Vaud Alps: Le Col des Mosses (CDM), Château-d’Oex (CHD) and Aigle (AIG). The sum is always calculated from 05:40 UTC of a given day to 05:40 UTC of the following day. Source: MeteoSwiss
| Date | EBK | STB | SEV | SWA |
|---|---|---|---|---|
10.02.1990 | 10.2 | 6 | 0.1 | 7.5 |
11.02.1990 | 6.3 | 7.6 | 0.2 | 7.2 |
12.02.1990 | 11.5 | 8.1 | 6.2 | 16.6 |
13.02.1990 | 65.2 | 48.2 | 70.5 | 56.8 |
14.02.1990 | 111.3 | 97.9 | 81.5 | 103.5 |
15.02.1990 | 25.4 | 52.9 | 54.1 | 28.3 |
Max 5-day sum | 219.7 | 214.7 | 212.5 | 212.4 |
Daily precipitation during the event and maximum 5-day precipitation sum between 10 and 15 February 1990 (both in mm) at stations located on the eastern Alpine north slope: Ebnat-Kappel (EBK), Starkenbach (STB), Sevelen (SEV) and Schwägalp (SWA). The sum is always calculated from 05:40 UTC of a given day to 05:40 UTC of the following day. Source: MeteoSwiss
At some stations (La Cure, Couvet, Les Charbonnières, Le Col des Mosses and Sevelen), the maximum 5-day precipitation measured during the event of 10 to 15 February 1990 corresponds to the largest 5-day precipitation sum measured between 1981 and 2014, all seasons considered. At other stations (Magglingen, Aigle, Ebnat-Kappel and Starkenbach), this event corresponds to the highest 5-day precipitation measured in winter between 1981 and 2014, but larger sums were measured during other seasons. Finally, at the remaining stations (Château-d’Oex and Schwägalp), this event figures in the top 10 of the highest 5-day winter precipitation between 1981 and 2014, although a number of other events brought larger precipitation sums in winter, as well as in other seasons.
