Service Navigation
Search
Daily precipitation and daily mean temperature
Between 10 and 12 February 1990, 25 to 70 mm of precipitation was measured in the Jura mountains, in the Vaud Alps and on the eastern Alpine north slope. With the passage of a cold front on 11 February, the snowline was lowered to around 700m altitude, and on 11 and 12 February the precipitation fell as snow in those regions, while it fell as rain in lower elevated areas, for e.g. at the foot of the Jura or at the foot of the Alpstein.
During the day of 13 February, the precipitation increased considerably, with a daily sum of 35 to 110 mm measured in the regions mentioned above. With the arrival of warm and moist air from the west during the night of 13 to 14 February, the temperatures increased (see figure below), the snow line rose to an altitude of approximatively 1700m and the snowfall turned into intense rainfall in the Jura mountains as well as in the parts of the Vaud Alps and the eastern Alpine north slope located below that altitude.
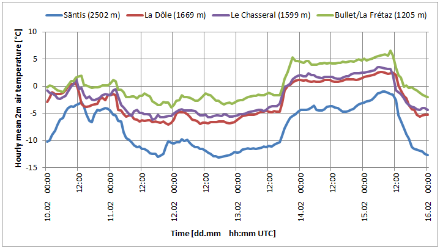
On 14 February, daily precipitation of 50 to 174 mm was measured in the Jura mountains and on the Alpine north slope, most of which fell as rain. The largest daily sum was recorded at station Col des Mosses (1412m) in the Vaud Alps, with 174 mm of precipitation in one day, while in the Jura 131.3 mm was measured at station La Cure (1185m) and 111.8 mm at station La Dôle (1669m). On the eastern Alpine north slope, 99.6 mm of rain was recorded at station Wildhaus (1000m) and 97.9 mm at station Starkenbach (890m), while station Säntis (2502m) measured 160 mm of precipitation and a fresh snow height of 43 cm on 14 February.
The precipitation lasted until the afternoon of 15 February, time when the temperature decreased again. That day, 10 to 69 mm of precipitation was measured in the regions mentioned above, which mostly fell as rain.
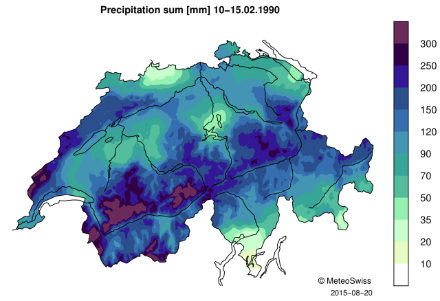
6-day precipitation sum for 10-15 February 1990
In total, between 10 and 15 February, the stations located in the Jura mountains, in the Vaud Alps and on the eastern Alpine north slope measured precipitation amounts corresponding to two to almost three times the amounts recorded on average in February at those stations (norm 1981-2010).
6-day precipitation for 10-15 February 1990 and average February precipitation (norm 1981-2010) for stations located in the Jura and on the western and eastern Alpine north slope (both in mm). Source: MeteoSwiss
| Station | Climate region | 6-day sum | Norm 1981-2010 |
|---|---|---|---|
Col des Mosses | Western Alpine north slope | 384.9 | 133.9 |
Säntis | Eastern Alpine north slope | 384 | 222 |
Braunwald | Eastern Alpine north slope | 334.7 | 169.7 |
La Cure | Jura | 329.5 | 147.4 |
| La Dôle | Jura | 287.3 | 149 |
Magglingen | Jura | 236 | 108.3 |
Ebnat-Kappel | Eastern Alpine north slope | 229.9 | 120 |
Starkenbach | Eastern Alpine north slope | 220.7 | 117.8 |
However, those regions are not the only areas in Switzerland that received intense precipitation during this event; some stations located on the central Alpine north slope or further inside the Alpine chain (Valais and Grisons) also recorded large precipitation amounts between 10 and 15 February, which correspond to almost three times the average February precipitation at those stations (norm 1981-2010).
6-day precipitation for 10-15 February 1990 and average February precipitation (norm 1981-2010) for other stations located in the alpine region (both in mm). Source: MeteoSwiss
| Station | Climate region | 6-day sum | Norm 1981-2010 |
|---|---|---|---|
Les Marécottes | Valais | 343 | 121.8 |
Gütsch ob Andermatt | Central Alpine north slope | 279.7 | 118.2 |
Weissfluhjoch | North and central Grisons | 231.8 | 89.7 |
Post snowfall temperature increase
Although during this event large precipitation amounts were not only measured in the Jura mountains but also in the Alps, the event did not have as severe an impact inside the Alpine range as it had in the Jura and on the Alpine north slope. In the latter regions, the determining factor was the arrival of warm and moist air from the west on 14 and 15 February, which not only generated intense rainfall up to a relatively high altitude (approx. 1700m), but also contributed to the melting of the snow that had accumulated there during the previous days, inducing an important increase in the runoff of the rivers located in those regions or further downstream. Further inside the Alpine range where the altitude is higher and thus the temperature lower, the warm air also arrived approximatively 24 hours later, resulting in the precipitation falling as snow in most areas during the event and being stored in the solid stock instead of contributing to the flow of the rivers, limiting the impacts in those areas.
Downloads
RhiresD is the spatial analysis of daily precipitation in Switzerland. The daily precipitation on day D corresponds to the rainfall and snowfall water equivalent accumulated from 06:00 UTC of day D to 06:00 UTC of day D+1. For more information about this data set, see the documentation given below.
TabsD is the spatial analysis of the daily mean air temperature 2m above ground level and is representative of the average from midnight to midnight UTC. For more information about this data set, see the documentation given below.