Service Navigation
Search
Focus
- Effects of global warming vary widely from region to region. Switzerland, with its geographical location, is one of the regions particularly affected by global warming.
- Globally, the temperature has risen by 1.3 to 1.4 degrees Celsius since pre-industrial times and will continue to rise by around 2.9 degrees Celsius in Switzerland by 2024.
- Switzerland's climate will continue to warm more than the global average in the future. With global warming of 3 degrees Celsius compared to pre-industrial times, a temperature increase of 4.3 to 5.7 degrees Celsius is expected in Switzerland compared to pre-industrial times.
- The temperature increase will affect all seasons, but will be most pronounced in summer.
Changes in average temperature have an impact on agriculture, energy demand, health, tourism and the spread of animal and plant species, amongst other things. Year-round warming leads to a shift in vegetation periods and harvest times, higher cooling and lower heating energy requirements, increased heat stress, and the spread of heat-adapted and decline of cold-adapted animal and plant species.
Further information on the effects of climate change and measures in various sectors can be found on the website of the National Centre for Climate Services (NCCS).
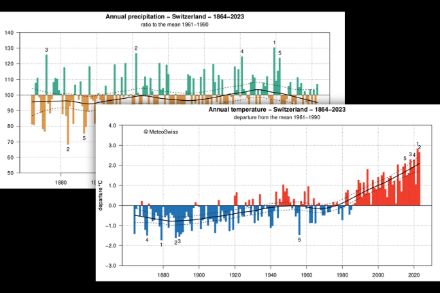
Observed average temperature change
Globally, temperature has risen by 0.9 degrees Celsius since pre-industrial times up to the reference period 1991–2020. Global temperatures have continued to rise since 1991–2020 and are currently 1.3 to 1.4 degrees above pre-industrial levels – already approaching the internationally agreed climate targets.
The observed warming in Switzerland is twice as strong as the global average: The observed warming in Switzerland is around 2 degrees Celsius up to the reference period 1991–2020 and around 2.9 degrees Celsius by 2024. Since the 1960s, each decade has been warmer than the previous one. North of the Alps, the increase was slightly greater than in the Alps and to the south. Apart from this, there are no major spatial differences in the warming trend in the annual averages. According to the current state of global climate research, it is clear that this development can only be explained by taking into account the contribution of humans to the increase in global greenhouse gas concentrations.
Different degrees of warming depending on the season
Looking at the individual seasons, there are clear regional differences in the warming trend. While the low-lying areas of the Swiss Plateau warmed more in winter than the mountain regions, the opposite was true in summer. In spring and autumn, all regions warmed at a similar rate, with temperatures rising more in autumn than in spring in most areas.
In autumn and winter, temperatures have developed in a very similar way since measurements began:
- Winter temperatures were at a particularly low level between approximately 1885 and 1895, and autumn temperatures between 1875 and 1920.
- In winter, a remarkably stable trend without any clear pattern was observed from 1900 to 1970, and in autumn from 1920 to 1980.
- In 1987 and 1988, there was a sudden shift to a pronounced warm winter phase. In autumn, there was a more gradual increase in the 1980s.
- Since the end of the 20th century, there have been no more very low autumn and winter temperatures.
In spring and summer, the temperature development was very similar:
- The 1940s were warmer than average.
- Between 1960 and 1980, temperatures remained steady.
- During the 1980s, temperatures rose significantly and have remained at a high level ever since.
Future temperature change
Change in annual average temperature
The climate scenarios show the possible future of the Swiss climate for different global warming levels (GWLs). They show the climate conditions that will prevail in Switzerland once the 30-year global average temperature has risen to 1.5 degrees Celsius (GWL1.5), 2 degrees Celsius (GWL2.0) or 3 degrees Celsius (GWL3.0) above the pre-industrial temperature level of 1871–1900.
The rate and thus also the point in time at which a certain warming level is reached depends fundamentally on the respective emissions scenario used. Global warming of 1.5 degrees Celsius compared to pre-industrial temperature levels – a so-called 1.5-degree world – is practically unavoidable due to past and current global greenhouse gas emissions and is expected to be reached in the next 5 to 15 years. A 2‑degree world would be reached at around 2050 with current and planned climate mitigation (SSP2-4.5) or at around 2040 if we continue to rely on using fossil fuels without implementing further climate mitigation measures (SSP5-8.5). A 3-degree world would become reality around 2065 if we continue to rely on using fossil fuels without implementing climate mitigation measures (SSP5-8.5). Based on the measures currently planned for global emissions reduction, the world is heading for a temperature rise of around 3 degrees Celsius by the end of the century (sources: IPCC, Climate Action Tracker (as of 2025)).

Climate scenarios show that the changes observed to date will continue in the future and that Switzerland will continue to warm more than the global average.
- In a 1.5-degree world, the average warming in Switzerland will be 2.6 to 3.2 degrees Celsius, compared to pre-industrial times and 0.6 to 1.2 degrees Celsius compared to 1991–2020.
- In a 3-degree world, the average warming in Switzerland will be 4.3 to 5.7 degrees Celsius compared to pre-industrial times and 2.3 to 3.8 degrees Celsius compared to 1991–2020. A year that is exceptionally warm in today's climate, such as 2022, will become the norm in a 3-degree world, with future peak years even significantly exceeding this level.
Global warming has a direct impact on the climate in Switzerland: an increase in extreme heat and drought in summer, an increase in the intensity and frequency of heavy precipitation events and a decline in snow cover.
Climate scenarios show that for all levels of global warming and for all seasons, temperatures in Switzerland will continue to rise in the future, compared to the reference period 1991-2020. The warming will be most pronounced in summer (June to August):
- In a 1.5-degree world, average summer temperatures will rise by 0.5 to 1.9 degrees Celsius, compared to the average for the reference period 1991-2020.
- In a 3-degree world, average summer temperatures will increase by as much as 2.4 to 5.1 degrees Celsius.
- In winter (December to February), the temperature increase is significantly lower than in summer.

The regional differences in temperature change are relatively small. With more severe global warming, the differences become slightly greater. There is a slight altitude dependence. The signs of change are slightly stronger at higher altitudes than at lower altitudes, especially in spring and summer. One reason for this amplification could be greater absorption of solar radiation due to the decline in snow cover, resulting in greater warming of the air near the ground. However, there are indications that the scenarios slightly overestimate this effect. Therefore, the altitude dependence of temperature trends should not be over-interpreted. The differences between urban and rural regions are more robust and are particularly noticeable in terms of heat stress.
More extreme heat
Extreme heat events have become more frequent and more intense in Switzerland. The impacts of extreme heat have already increased significantly, particularly at low altitudes and in urban areas. These trends are set to continue in the future.