Service Navigation
Search
Cities are more densely built up and characterized by a larger percentage of impermeable surfaces, compared to the more rural surroundings. Buildings, vehicles and industrial facilities all emit heat into the urban environment. These factors lead to a changed local climate, in terms of air temperature, humidity, radiation and wind, as well as air quality and noise pollution.
The urban heat island
The so-called urban heat island is a typical feature of the urban climate and varies in intensity, depending on the size of the city and its structure (building materials and density, proportion of vegetation, ventilation). The urban heat island effect occurs throughout the year. However, the greatest temperature difference between the city and its surrounding areas is reached in summer and is particularly pronounced at night. In Swiss cities, the night-time temperature is up to 5-7 degree Celsius higher than in the surrounding rural areas. During the day, the differences between the city and the surrounding area are usually smaller and the air temperatures in cities are often only slightly higher. As a result, the number of tropical nights (daily minimum temperature of 20 °C or more) is significantly higher in cities than in the surrounding area, while the number of hot days (days with a maximum temperature of 30 degree Celsius or more) is only slightly higher. In street canyons or urban areas without vegetation however, daytime temperatures can be considerably higher than in the rural surroundings.
These are the main factors responsible for the urban heat island development:
- Building materials store heat very effectively, which means that cities heat up more during the day compared to rural locations, and also cool down much slower.
- Due to numerous, densely packed buildings and the large proportion of impermeable surfaces, ventilation in the city and thus removal of heat and heat radiation is restricted.
- Vegetation and natural soil in the more rural surrounding have a cooling effect, as they release water vapor into the air and thus act as nature’s air conditioner. In cities however, the ground is largely covered by impermeable surfaces and so storage of precipitation in the soil is hindered. Thus, such temperature rebalancing is mostly lacking.
- Man-made pollutant emissions in cities (e.g. from traffic) further reduce the radiation emitted by the surface. Moreover, buildings, vehicles and industrial facilities all emit heat into the urban environment and contribute to the urban heat island.
The urban heat island phenomenon is more pronounced during high-pressure weather, when calm, clear weather conditions prevail, with very little wind and strong solar radiation. This is particularly the case during heat periods.
It is mainly the higher night time temperatures that pose a health risk to people living in urban areas. The human body has little opportunity to recover when nights are not sufficiently cool, which also makes it less able to withstand heat stress during the daytime. Urban planning and architectural measures are needed in order to mitigate or avoid such negative consequences. In addition, it is important to issue timely and effective heat warnings, working in close collaboration with communal/local and cantonal authorities. MeteoSwiss indicates the higher level of heat stress in urban areas in their heat warnings . Swiss cantons and major cities have drawn up heatwave plans and are already implementing measures to adapt to and mitigate the consequences.
Here you will find reports on heat in cities and the basis for adaptation measures based on previous Swiss climate scenarios:
Observations in urban areas
In recent years, observational networks have seen significant expansion with urban weather stations. These stations can provide more detailed information on the intensity and the temporal and spatial distribution of urban heat stress. The measurements provide the planning basis for climate-adapted urban development. For example, the data enable planners to specifically target measures that can help reduce the urban heat island effect. The observational networks and weather stations are operated by communal or cantonal authorities, universities and private individuals. MeteoSwiss does not operate weather stations in urban areas, as these locations do not meet international measurement standards (that is, a relatively open and natural environment).
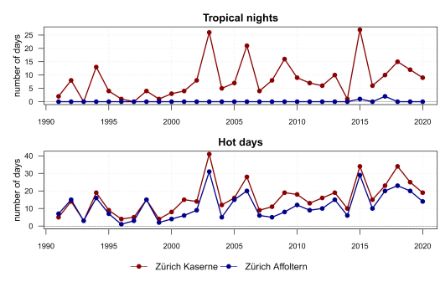
By comparing measurements of a station in an urban area with an adjacent station in a more natural surrounding it is possible to account for the urban heat island effect. A station couple that demonstrates this phenomenon is the rural station Zurich-Affoltern operated by MeteoSwiss and the urban station Zurich-Kaserne operated by the National Air Pollution Monitoring Network (NABEL) of the Federal Office for the Environment (FOEN).
Urban heat stress in the future
As a result of global climate change, urban residents are increasingly exposed to heat stress. Given the large and growing proportion of the world's population living in cities, it is essential to understand future climate conditions in urban environments. Only then can effective mitigation and adaptation strategies, tailored to urban areas, be developed.
As part of the current CH2025 climate scenarios, MeteoSwiss also shows the possible future development of selected climate indicators in five Swiss cities: Basel, Bern, Geneva, Lausanne and Zurich. Climate projections for rural and urban stations are determined for these cities. This illustrates the increased future heat stress in cities.
Although the average warming in urban and rural areas is similar, most urban areas will be more affected by rising temperatures than their rural surroundings. This can be clearly illustrated, for example, by the increasing number of tropical nights per year or the rising temperature of the warmest night of the year. For example, between 1991 and 2020, an average of eight tropical nights per year were observed at the Zurich Kaserne urban station, compared to only one at the less central and more elevated Zurich/Fluntern station. With global warming of 3 degree Celsius compared to pre-industrial times – in a so-called 3-degree world (GWL3.0) – an average of around 18 tropical nights would be expected in Zurich/Fluntern and as many as 41 tropical nights per year in Zurich city centre. In extreme years, the figures are even significantly higher. Four other Swiss cities studied (Basel, Bern, Geneva, and Lausanne) show a similar trend.

The urban heat island effect is also evident in the projected increase in the temperature of the warmest night of the year. In today's climate (1991-2020), for example, this temperature is 22,3 degrees Celsius at the Zurich Kaserne urban station and 19,6 degrees Celsius at the less centrally located Zurich/Fluntern station, just below the threshold of 20 degree Celsius that defines a tropical night. In a 3-degree world, the temperature of the warmest night of the year in Zurich Kaserne rises to 25,6 degrees Celsius and in Zurich/Fluntern to 23,2 degrees Celsius. A similar trend can also be observed for the other four Swiss cities studied (Basel, Bern, Geneva and Lausanne).

Heat stress can vary greatly within a city, depending on location. This depends heavily on the proportion of built-up areas and the exact structure of green and impervious surfaces within the city. This is also clearly demonstrated by a case study of the city of Bern. Temperatures were measured at 55 measuring stations within the city over several summers between 2018 and 2024. These measurements show that between 2018 and 2024, almost no tropical nights were observed in the surrounding area, whereas in the city centre there were up to five per year. Using these data, future climate projections for urban areas can also be developed. As the case study shows, tropical nights in concreted and densely populated urban areas, such as city centres, are expected to be twice as frequent in the future climate as in green urban areas, such as parks and forests. In a 3-degree world, up to ten tropical nights per year would be expected in green areas of Bern and up to 21 in the city centre.

The increasing heat stress is also clearly evident from the number of days on which the daily average temperature is at least 25°C. For individual days of this kind, MeteoSwiss issues a level 2 heat warning in today's climate. If the daily average temperature is at least 25 degrees Celsius over a period of at least three consecutive days, a level 3 heat warning is issued for these days. These heat warning levels are issued for the entire region in which the forecast temperature reaches the threshold value. Days with a theoretical heat warning can also be projected for the future climate by determining the number of days that may reach the respective thresholds from the scenarios.

Observations show that, in the current climate, there are hardly any days in Switzerland with a level 3 heat warning. Up to three such days can be expected per year, mainly in urban areas. However, climate model simulations show that a significantly higher number of such days per year can be expected in the future climate: in a 1,5-degree world there will be up to ten days and in a 3-degree world up to 20 days per year. In addition, larger regions will reach the thresholds for a level 3 heat warning. In a 3-degree world, almost the entire west, north and north-east of Switzerland, Ticino and the valleys in Valais would be affected.
The number of days per year for which the daily average temperature exceeds 25 degrees Celsius over a period of at least three consecutive days can also be determined for the station pairs in five Swiss cities. This makes it possible to demonstrate prolonged heat stress in cities more accurately and to compare it with heat stress in their rural surroundings. For example, the current average (reference period 1991-2020) of such days in the more rural Zurich/Fluntern area is around one day per year. In a 1,5-degree world, approximately three days per year would be expected, and in a 3-degree world, as many as 12 days per year. In the urban environment of the Zurich Kaserne station, up to four such days per year can be expected on average in today's climate. With global warming of 1,5 °C and 3 °C, this number would increase to around eight and 23 days per year, respectively. A similar trend can be observed in the four other Swiss cities (Basel, Bern, Geneva, and Lausanne) (see table).
Number of heat warning days per year (level 3) | ||||||
|---|---|---|---|---|---|---|
| Reference period 1991-2020 | GWL1.5 | GWL3.0 | ||||
| Rural | Urban | Rural | Urban | Rural | Urban | |
| Basel | 2 | 4 | 5 | 6 | 15 | 19 |
| Bern | 0 | 2 | 1 | 4 | 9 | 16 |
| Geneva | 2 | 8 | 6 | 11 | 19 | 28 |
| Lausanne | 2 | 4 | 5 | 8 | 18 | 23 |
| Zurich | 1 | 4 | 3 | 8 | 12 | 23 |
Average number of days per year with a daily mean temperature ≥25°C over a period of at least three consecutive days for five cities in today's climate (1991-2020) and in the future climate in the future climate for a 1,5-degree world (GWL1.5) and a 3-degree world (GWL3.0) (median in each case).


