Service Navigation
Search
Since 1864, temperature and precipitation has been systematically measured in various measuring stations scattered throughout the country. The series of measurements produced this way provide information about the development at various locations in Switzerland over a period spanning many years. A mean temperature and precipitation amount for all of Switzerland is used to describe the general development in the country as a whole.
Data available from 1864
The Swiss temperature and precipitation means are formed on the basis of monthly values, are available from the start of measurements in 1864 and are continuously updated with the latest monthly values. The data can be obtained from the MeteoSwiss customer service.
Due to its key role as an indicator of climate change, the Swiss temperature mean is also published on the following website and clearly identified with a Digital Object Idetifier (DOI), also with regard to different versions.
From the station data to the Swiss mean
Using the station data, MeteoSwiss calculates the temperature for locations in Switzerland without a measuring station. This grid temperature data shows the regional distribution of the air temperature in Switzerland at a specific time or in a specific period. The mean of all these grid points gives rise to a mean temperature within reasonable limits in Switzerland.
The grid data has been available since 1981 in high resolution. But to still have the Swiss temperature mean available starting in 1864, it was analysed how the station measurements of the Swiss National Basic Climatological Network have to be combined to approximate the mean as closely as possible for the period from 1981 to 2014. Depending on how representative each station is for the Swiss temperature mean, it is assigned a weaker or stronger weighting.
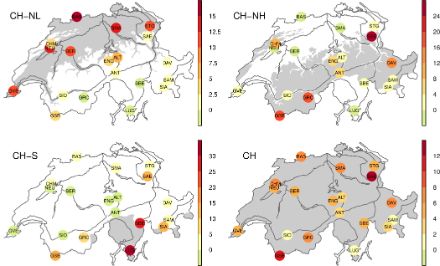
For temperature the mountain stations Col du Grand St-Bernard and Säntis have the highest weighting. They are the only stations to represent altitudes higher than 2000 m above sea level in Switzerland. There are more stations available for the lower regions. These locations therefore have a lower weighting in the Swiss temperature mean.
There were significantly fewer stations available for precipitation in the 19th century than later. The number of stations included in the Swiss mean and their weighting therefore differ before and after 1901. Stations in areas with lower station densities generally receive higher weights in both cases (e.g. Valais), regardless of altitude. In the period 1864-1900 in particular, it is clear that individual stations have to cover relatively large areas, which is associated with increased uncertainty for the Swiss mean.
Mean of subregions of Switzerland
Switzerland is divided into different climate regions. In terms of temperature development over many years, the differences between the north side of the Alps and the south side as well as the different altitudes are interesting. As a result, a temperature mean is calculated for the following three subregions using the same methodology as for all of Switzerland (CH): North side of the Alps lower than 1000 m a.s.l. (CH-NL), North side of the Alps above 1000 m a.s.l. (CH-NH), South side of the Alps (CH-S). The south side of the Alps includes, besides the Canton of Ticino, the Simplon region and the southern Grisons valley. The weightings of the stations (coefficients of the multiple linear regression) shift accordingly and can also be negative.
Accuracy compared to the "real" grid mean
From the period with available, high resolution grid data from 1981 to 2014, only 20 years were used in a test to determine the weightings of the measuring stations. The remaining 14 years were then available to assess the accuracy of the Swiss temperature mean compared to the grid data. It is shown that the monthly values of the Swiss temperature mean provided can deviate in average by around ±0.1 degrees from the "real" grid mean. The potential error is generally smaller in summer and for the aggregates (seasonal, semi-annual, annual).
Mean of subregions of Switzerland
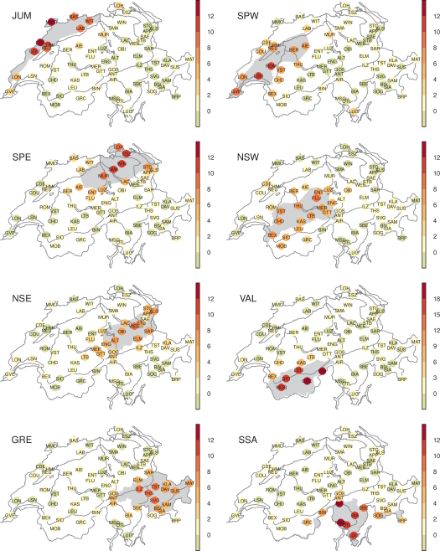
Switzerland is divided into different climatic regions, which receive different amounts of precipitation due to the topography (hills, mountains, valleys, lowlands) and depending on the season. With regard to long-term precipitation trends, differences between the Jura, the Central Plateau, the northern slopes of the Alps, inner-Alpine areas and the southern side of the Alps are therefore of interest. For this reason, a precipitation average is calculated for the following eight subregions using the same methodology as for Switzerland as a whole (CH): Jura (JUM), western Swiss plateau (SPW), eastern Swiss plateau (SPE), northern slopes of the western Alps (NSW), northern slopes of the eastern Alps (NSE), Valais (VAL), Grisons and Engadine (GRE), southern side of the Alps (SSA). In addition to the canton of Ticino, the southern side of the Alps also includes the Simplon region and the southern valleys of Grisons. The weightings of the stations (coefficients of the multiple linear regression) shift accordingly and can also become negative. Due to the low station density in the 19th century, the regional averages are only calculated from 1901 onwards.
Accuracy compared to the "real" grid mean
In order to analyze the uncertainty of the Swiss mean and the regional means, only 30 years from the period with available, high-resolution grid data from 1961 to 2020 were used in a test to determine the weights of the measuring stations. The other 30 years were then available to assess the accuracy of the Swiss mean compared to the "true" grid mean. It can be seen that the mean error in the monthly values of the Swiss mean before 1901 is around 8%, after 1901 around 4%. The regional averages show a mean error of 4% to 7%. For the aggregates (season, half-year, year), the mean error tends to be smaller.