Service Navigation
Search
Before the dawn of automatic measurements, providing continuous information, foehn frequency was only recorded for the three daily observation times – morning, noon and evening. In order to obtain a consistent data series over the long term, the frequency of foehn is also determined today from the automatic measurements taken at these three times of day.
Large fluctuations in the short term
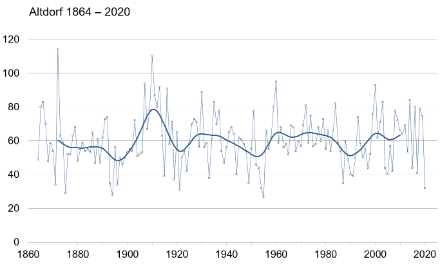
The frequency of foehn can vary greatly from year to year, as the figure shows. In 1872, foehn was recorded at 114 time stamps, and in 1910 at 110. In all other years foehn was recorded at fewer than 100 time stamps in Altdorf. 1955 was the year with the least foehn activity in Altdorf: Foehn was only present at 27 time stamps. There were marginally more occurrences of foehn in 1894 (28) and in 1875 (29).

With the exception of 1872, the year in which the most foehn activity was recorded, years with high foehn frequency were predominately clustered within multi-year phases of increased foehn activity. The same also applies the other way around: Years with low foehn frequency are often found clustered in multi-year phases with little foehn activity. No scientific studies have as yet been conducted on the causes of such fluctuations in foehn frequency.
Very constant in the long term
Aside from short-term fluctuations, the long-term behaviour of foehn frequency is extremely balanced. The annual mean between 1864-2020 is 60 observational time stamps. For the most part, the long-term average is slightly above or slightly below this mark.
The only striking deviation is the data series around 1910, with its significantly higher foehn frequency. It is striking that before this increased foehn activity the long-term average is slightly below, and thereafter mostly slightly above the overall average of 60 observational time stamps. Over the data series as a whole, no trend towards higher or lower foehn frequency can be detected.