Service Navigation
Search
The graphic charts are updated regularly in accordance with the existing data quality. Precipitation details are tentative until the 26th day of the following month and may not yet be complete. Global radiation data and hail information are available several days after the end of the month.
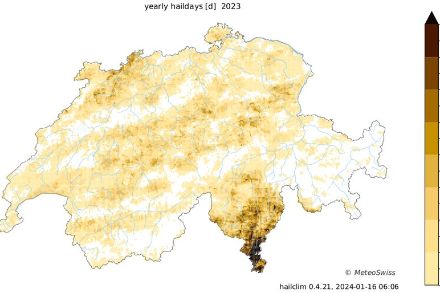
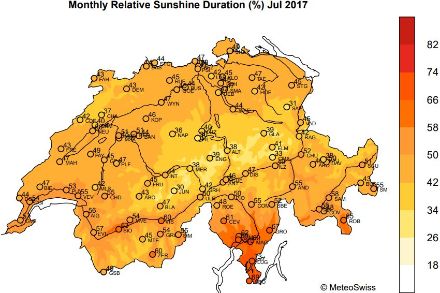
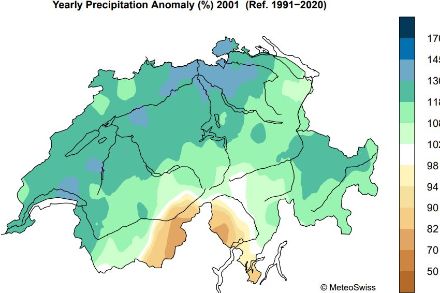
The deviations for the temperature, precipitation and hours of sunshine are shown in comparison to the long-time average, the so-called normal values, from 1991-2020. The deviations of the global radiation relate to the average values from 2004 until present. The deviations for hail refer to the mean value from 2002 to the present. The respective weather pattern for the month, season and year is described extensively in the climate bulletins; they can be retrieved under climate reports.
Acquisition of grid data
Spatial climate analyses can be requested from MeteoSwiss in different temporal and spatial resolutions. Detailed information on the available data products can be found under Service & Publications.