Service Navigation
Search

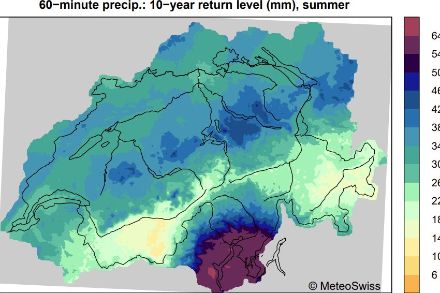

For design applications, the return values at each grid point for selected return periods are available on hydromaps.ch, under “Water in the Atmosphere; B04 Extreme Point Precipitation”.
For design applications, the return values at each grid point for selected return periods are available on hydromaps.ch, under “Water in the Atmosphere; B04 Extreme Point Precipitation”.