Service Navigation
Search
Return periods of the largest 1-day precipitation between 24 and 28 July 2014
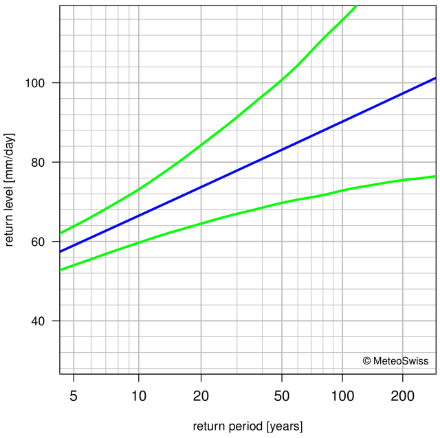
In the Emmental/Entlebuch region, the largest 1-day precipitation between 24 and 28 July 2014 was not exceptional, except at station Luthern. The rainfall amount recorded at that station on 28 July (78 mm) has a return period between 10 and 20 years.
Although on a daily perspective the largest rainfall amounts measured between 24 and 28 July at most stations occur quite frequently, this does not mean that the precipitation was not intense and exceptional when considering a shorter time frame. Indeed, since the precipitation was generated by thunderstorms, most of the rain measured each day fell within a short time lapse during the afternoon or night.
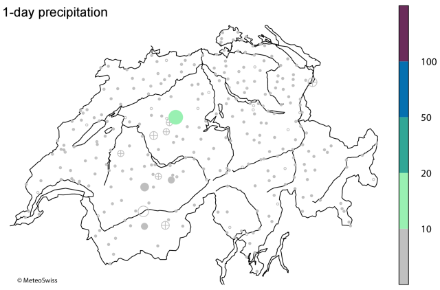
The map above shows the return periods of the largest 1-day precipitation measured between 24 July 2014, 05:40 UTC and 29 July 2014, 05:40 UTC. The return periods are based on the generalized extreme value distribution estimated from the annual 1-day precipitation maxima during the period 1961-2010. The size of the circles is proportional to the value of the return period. The filling of the circles indicates the reliability of the statistics: good (filled circle), questionable (circle with cross) and poor (empty circle).
Return periods of the largest hourly and 10-minute precipitation
The return periods of the largest hourly and 10-minute precipitation are available at fewer stations than for daily precipitation. In the Emmental/Entlebuch region, the only station for which such statistics are available is Napf. At that station, the largest 1 and 2-hour precipitation measured between 24 and 28 July 2014 are not exceptional, corresponding to return levels with return periods smaller than 10 years (for respectively 29.1 mm/h and 37.8 mm/2h, not shown here). The largest 10-minute precipitation (11.9 mm) also has a low return period (< 10 years, not shown).
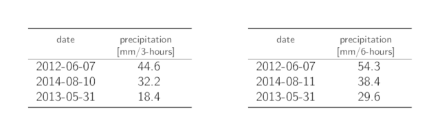
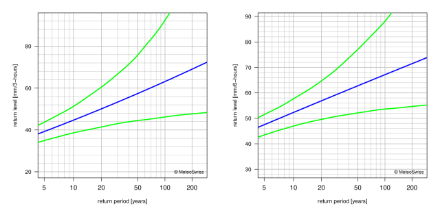
However, the largest 3, 4 and 6-hour precipitation measured at that station (respectively 46.2 mm, 52.9 mm and 54.4 mm) were more rare and correspond to 10 to 20-year events (see figures in the slideshow below for the largest 3 and 6-hour precipitation).
Since thunderstorms have very local impacts, station Napf might not be representative of the precipitation that fell in the whole Emmental/Entlebuch regions. Although the largest 10-minute, 1-hour and 2-hour precipitation measured at that station correspond to return periods of less than 10 years, the rainfall in other places during those time intervals could have been different. In particular in the elevated regions of the upper Emmental and upper Entlebuch, where the rough topography favors the formation of convective clouds and the development of thunderstorms, the events could have been more exceptional.
Maps of the return periods (in years) of the largest 3-hour and 6-hour precipitation measured between 23 July 2014, 23:40 UTC and 28 July 2014, 23:40 UTC. The return periods are based on the generalized extreme value distribution estimated from the annual 3-hour and 6-hour precipitation maxima during the period 1981-2014 and only stations with at least 25 years of observation are shown. The size of the circles is proportional to the value of the return period. The filling of the circles indicates the reliability of the statistics: good (filled circle), questionable (circle with cross) and poor (empty circle).
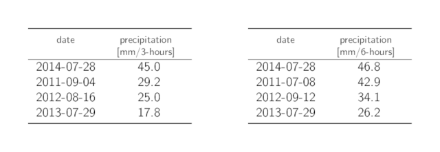
Extreme value analyses for 3-hour, 6-hour and 1-day precipitation
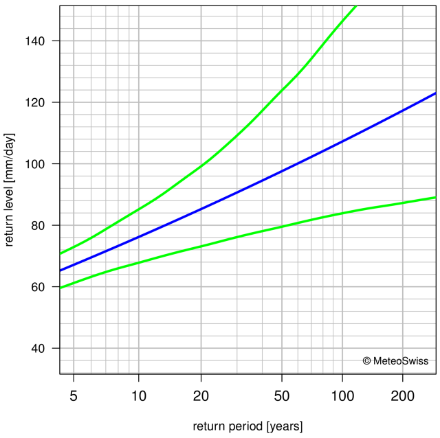
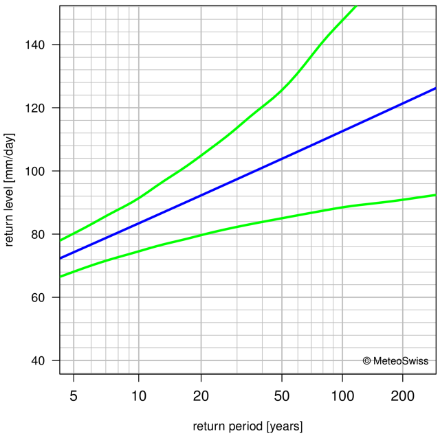
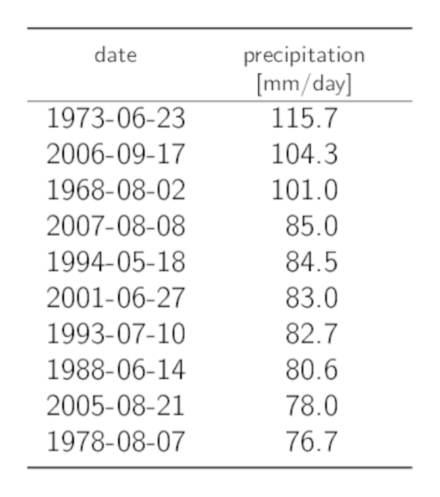
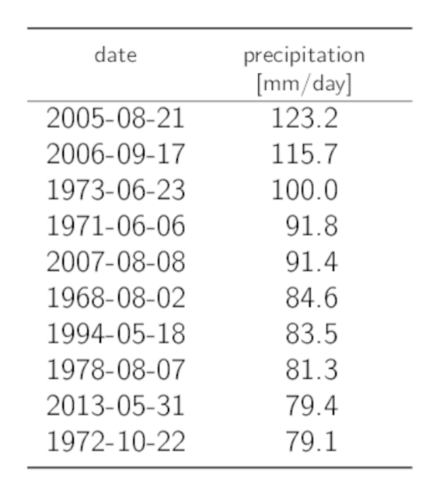
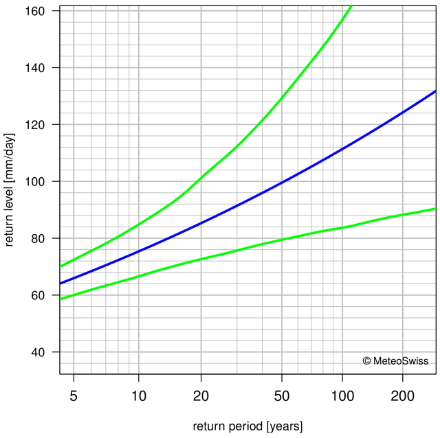
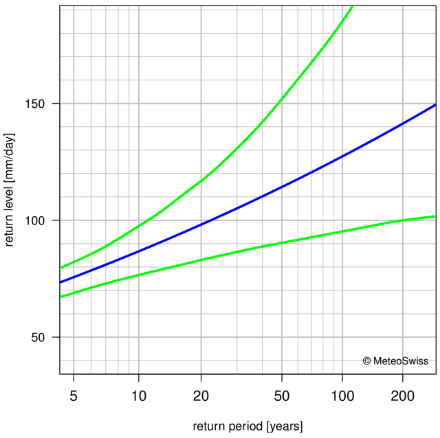
This section provides the extreme value analyses for the stations presented in the section Hyetographs. The statistics are based on the periods 1981-2014 (hourly precipitation) and 1961-2010 (daily precipitation). Return level plots of 3-hour, 6-hour or 1-day precipitation maxima are shown when the statistics are reliable. When the statistics are not reliable or when the length of the records is too short, tables of the ten highest precipitation maxima for the period 1961-2014 or between the beginning of the measurements and 2014 are shown instead. In addition, PDFs of the extreme value analyses are given when the reliability of the results is good or questionable.
Analyses for hourly precipitation
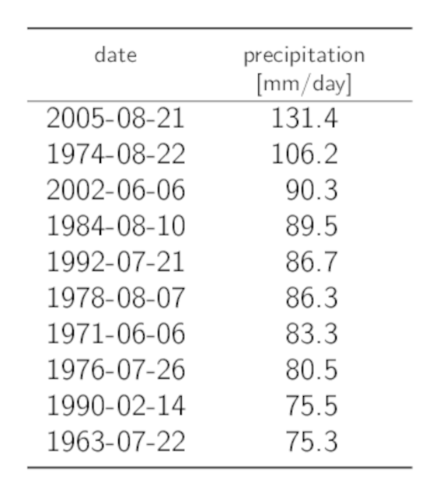
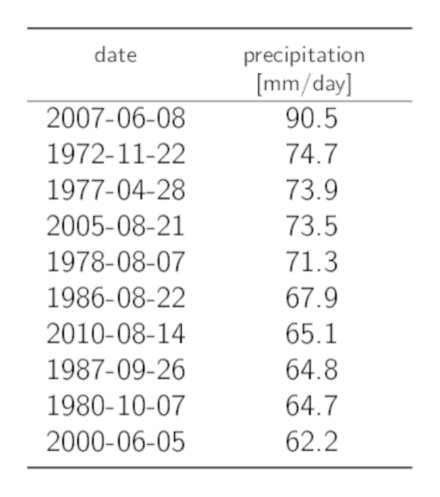
Analyses for daily precipitation