Service Navigation
Search
Hourly precipitation
Only four stations measuring hourly precipitation are located in the regions of the Emmental and the Entlebuch (see figure below) and unfortunately none is located in the elevated areas of those regions. Nevertheless, we notice that between 24 and 28 July 2014, most of these stations measured two to three precipitation events on 24, 26 and 28 July, with different intensities depending on the station.
For all four stations, the third precipitation event on 28 July was the most intense and larger rainfall amounts were measured than during the first two events on 24 and 26 July. At station Schüpfheim (Entlebuch), a peak with a maximum of 34.9 mm of rain was measured in one hour, while 29.1 mm were measured in one hour at station Napf (Emmental). During this precipitation event, the rainfall also lasted longer than during the previous two events (e.g. up to 24 hours at station Napf).
During the precipitation events of 24 and 26 July, on the other hand, lower precipitation was measured since these stations are not located in the zone where the highest preciptiation occured (i.e. the upper Emmental and upper Entlebuch, see section Precipitation and temperature). Only station Schüpfheim measured an intense precipitation peak on 26 July, with 13.7 mm of rain within one hour.
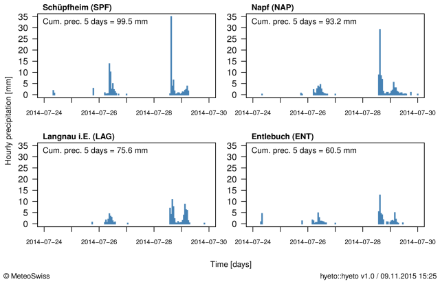
The hourly precipitation (mm) is represented in the hyetographs by the vertical blue bars and the date is given on the time axis, where each day begins at 00 UTC. The cumulated precipitation over the duration of the events (5 days) is indicated in the top left corner of the plots and corresponds to the precipitation measured between 24 July 2014, 05:40 UTC and 29 July 2014, 05:40 UTC.
Ten minute precipitation
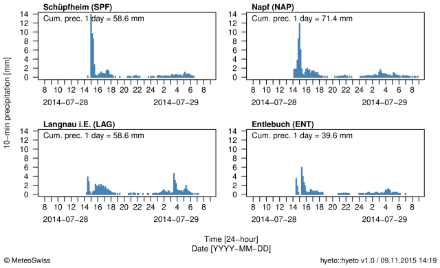
Cumulated precipitation over 10 minutes is also available at the four stations presented above. The hyetographs below show the 10-minute precipitation measured during the most intense event on 28 July 2014.
At station Schüpfheim, the rainfall started very suddenly in the afternoon with very high intensity; it passed from almost no rain to 13.8 mm/10 min. Within 30 minutes (14:50-15:20) it fell 31.8 mm of rain, i.e. more than half of the total precipitation measured that day (58.6 mm).
At station Napf, the rainfall showed a similar pattern as for station Schüpfheim, but was less sudden and the intensity was slightly lower. Within 40 minutes (14:30-15:10), 30 mm of rain were measured, with a maximum intensity of 11.9 mm/10 min. This represents a little less than half of the rainfall of 28 July at that station (71.4 mm).
At stations Entlebuch and Langnau im Emmental, a precipitation peak was also measured during the afternoon of 28 July, but the intensity was lower intensity than at the stations mentioned above. The highest intensities reached 5.9 mm/10 min at station Entlebuch and 4.5 mm/10 min at station Langnau im Emmental.
The differences between the precipitation measured at stations relatively close in space (e.g. Schüpfheim and Entlebuch) highlights the very local nature of the thunderstorms that caused these intense rainfall events.
Daily precipitation
Although the precipitation event of 28-29 July 2014 is well captured at the stations presented above, these stations did not measure large rainfall amounts on 24 and 26 July (with the exception of station Schüpfheim). In the affected area, there are also stations that measure daily precipitation, at which higher daily precipitation sums were sometimes measured on 24, 26 and 28 July. When looking at this table, the short-term nature of the events is also visible, since the stations did not measure large rainfall amounts on 25 and 27 July between the precipitation events.
Daily precipitation (in mm) at stations located in or close to the regions of the Emmental and Entlebuch for 24-28 July 2014. The sum is always calculated from 05:40 UTC of a given day to 05:40 UTC of the following day. Source: MeteoSwiss
| Station | 24 July | 25 July | 26 July | 27 July | 28 July |
|---|---|---|---|---|---|
Entlebuch | 5.1 | 3.7 | 12.1 | 0 | 39.6 |
Eriswil | 0 | 0.1 | 6.1 | 0 | 53.2 |
Escholzmatt | 1.3 | 2 | 29.8 | 0 | 40.2 |
Flühli | 4.7 | 3.6 | 22.7 | 0.2 | 42.4 |
Grosshöchstetten | 0 | 1 | 21.2 | 0.5 | 64 |
Kurzeneialp | 0 | 5.6 | 7.1 | 0 | 64.7 |
Langnau im Emmental | 0 | 0.9 | 16.1 | 0 | 58.6 |
Luthern | 0 | 0 | 9.6 | 0 | 78 |
Marbach (LU) | 1.7 | 1 | 37.7 | 0.1 | 46 |
Napf | 0.1 | 2.7 | 19 | 0 | 71.4 |
Schüpfheim | 2.2 | 3.4 | 35.3 | 0 | 58.6 |
Schwarzenegg | 30.5 | 8.4 | 24 | 0 | 48.5 |
During the first precipitation event on 24 July, relatively large rainfall amounts were only measured at station Schwarzenegg in the region of Thun (30.5 mm). At the other stations, almost no precipitation was recorded that day, since most of the precipitation in the Emmental/Entlebuch was concentrated over the upper Emmental, region in which no measurement station exists.
On 26 July, during the second precipitation event, relatively large daily precipitation sums were measured in the Entlebuch at stations Marbach (37.7 mm), Schüpfheim (35.3 mm) and Escholzmatt (29.8 mm).
Finally, during the third precipitation event on 28 July, the highest rainfall amounts of all three events were measured in the affected region. For example, station Luthern measured 78 mm of rain, station Napf 71.4 mm, station Kurzeneialp 64.7 mm and station Grosshöchstetten 64 mm.
During these five days, the highest 5-day precipitation sum was measured at stations Schwarzenegg (111.4 mm), Schüpfheim (99.5 mm) and Napf (93.2 mm).
Comparison with other heavy precipitation events
The plot in the infobox below shows the comparison of the maximum 30-minute precipitation measured between 24 and 29 July 2014 with other precipitation events for station Napf. Due to too short time series, no comparison is shown for stations Entlebuch, Langnau im Emmental and Schüpfheim.
At station Napf, the maximum 30-minute precipitation measured during this event (26.3 mm on 28 July) did not bring the largest rainfall amounts measured in summer between 1981 and 2014, since it only has a ranking of 7. Other events brought larger precipitation sums, for example in the months of July of 2006 (41.4 mm) and 2012 (37.4 mm). The maximum 10-minute precipitation (not shown here) was even less exceptional, with a ranking of 24 (11.9 mm/10 min).
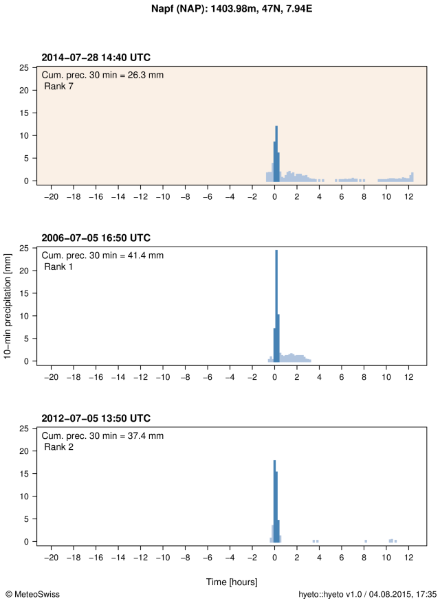
Comparison of the event (beige background) with two other large 30-minute precipitation sums (white background) that were measured at station Napf (Emmental) in summer (JJA) between 1981 and 2014. The 10-minute precipitation [mm] is represented by vertical bars: blue during, and grey before and after the 30-minute intervals. The dates and times corresponding to the beginning of the 30-minute intervals are given above the plots and indicated by 0 on the time axis. The rank indicates the ranking of the events compared to other 30-minute precipitation sums at that station.
Moving sums of 10-minute precipitation cumulated over a duration interval of 30 minutes are used in order to determine both the highest 30-minute precipitation sums at the given stations between 24 and 29 July 2014 and the ranking of the event compared to other precipitation sums of same duration for the same season (JJA).