Contents area

Extreme value analyses

Extreme value analyses for stations located within the affected regions of the precipitation event of 22-25 September 1993.

Footer

Top bar Navigation

Swiss federal authorities

Service Navigation

Return periods of 4-day precipitation for 22-25 September 1993

This event was localized on the southern side of the Alps as indicated by the colored stations in the map of the return periods below. The recorded precipitation between 22 and 25 September 1993 at a number of stations located in the Upper Valais and in Ticino correspond to return levels having return periods of up to 50 years.

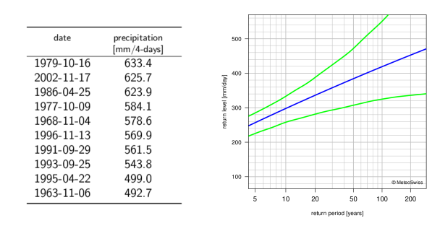
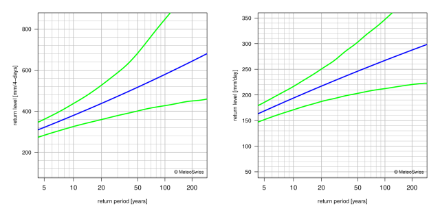
The amounts recorded during the 4 days were the rarest at stations Bosco-Gurin (Ticino, 445.1 mm), Cevio (Ticino, 478.6 mm), Binn (Valais, 381.4 mm) and Simplon-Dorf (Valais, 374.8 mm), with corresponding return periods of 20 to 50 years.

Map of Switzerland with, in colored circles, the return periods of the 4-day precipitation between 22 and 25 September 1993.
Map of the return periods (in years) of the 4-day precipitation for 22-25 September 1993.

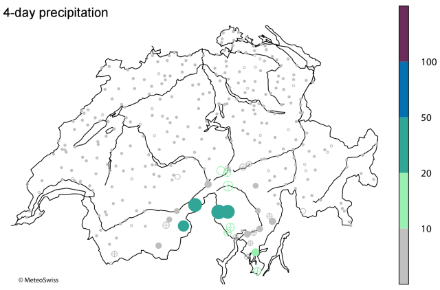
The 4-day precipitation is measured between 22 September 1993, 05:40 UTC and 26 September 1993, 05:40 UTC. The return periods are based on the generalized extreme value distribution estimated from the annual 4-day precipitation maxima during the period 1961-2010. The size of the circles is proportional to the value of the return period. The filling of the circles indicates the reliability of the statistics: good (filled circle), questionable (circle with cross) and poor (empty circle).

Return periods of the largest 3, 2 and 1-day precipitation

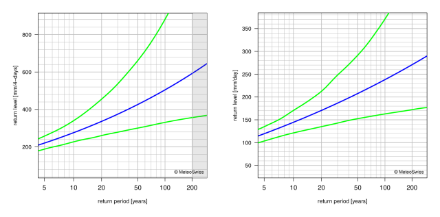
For the two stations located in the Upper Valais, not only was the 4-day precipitation rare, but also the largest 3-day and 2-day precipitation sums during the event were exceptionally high, with return periods between 20 and 50 years (Simplon-Dorf: 366 mm/3days, 292.4 mm/2days; Binn: 355.4 mm/3days, 271.5 mm/2days). The 1-day largest precipitation was still unusual (182.2 mm at Simplon-Dorf and 161.5 mm at Binn), corresponding to a 10 to 20-year event, but was less exceptional than the accumulated precipitation over several days.

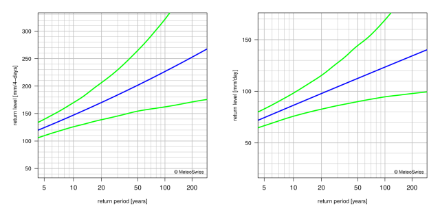
For station Bosco-Gurin in Ticino, the largest 3-day precipitation (426.9 mm) was even more extreme than the 4-day precipitation, corresponding to a 50 to 100-year event. The 2-day precipitation was still exceptionally high (corresponding return period of 20-50 years), whereas the largest 1-day precipitation was not unusual.

In the other parts of Ticino, some stations received 3-day or 2-day precipitation corresponding to 10 to 20-year events, but the largest 1-day precipitation was not unusual. This event marked, however, the beginning of a period with a lot of precipitation in the Ticinese region that lasted until mid-October, the accumulation of which contributed to flooding in several parts of Ticino (FOEN, 1994).

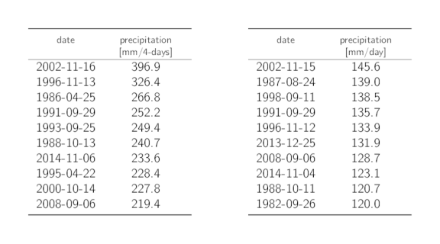
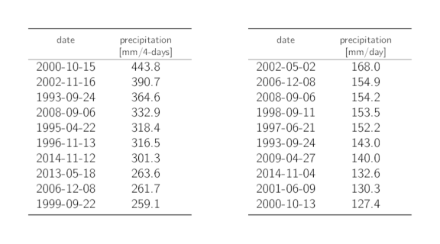
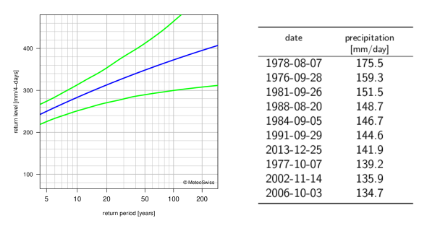
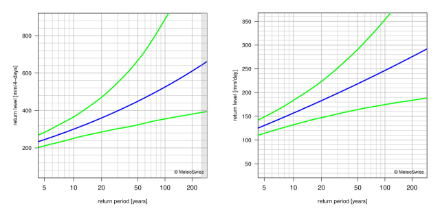
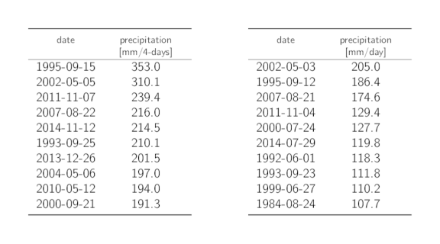
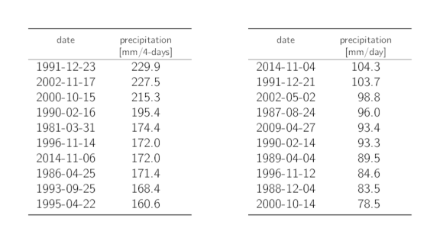
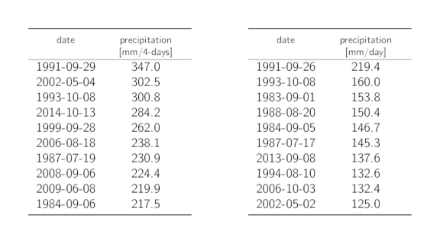
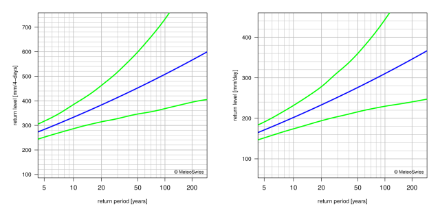
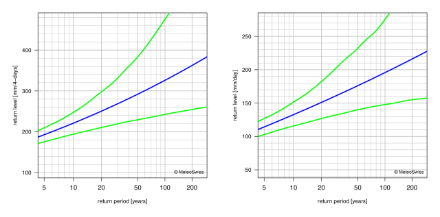
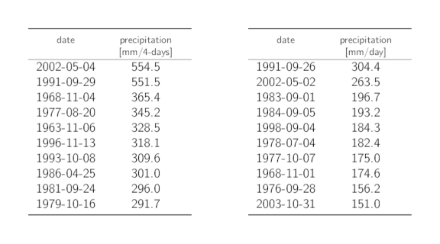
Extreme value analyses for 4-day and 1-day precipitation

This section provides the extreme value analyses for the stations presented in the section Hyetographs. The statistics are based on the period 1961-2010. Return level plots of 4-day and 1-day precipitation maxima are shown when the statistics are reliable. When the statistics are not reliable or when the length of the records is too short, tables of the ten highest precipitation maxima for the period 1961-2014 or between the beginning of the measurements and 2014 are shown instead. In addition, PDFs of the extreme value analyses are given when the reliability of the results is good or questionable.

Acquarossa/Comprovasco
Tables listing the dates of the 10 highest annual 4-day and 1-day precipitation maxima with the corresponding precipitation sums.
10 highest annual 4-day (left) and 1-day (right) precipitation maxima at station Acquarossa/Comprovasco between 1961 and 2014 (with 12 missing years in the time series). Precipitation sums are calculated from 05:40 UTC of one day to 05:40 UTC of the following day. The date indicates the last entire day over which the precipitation is summed.

Binn
Return level plots showing, with lines, the best estimate for the return levels and the corresponding 95% confidence intervals.
Plots of return levels and their uncertainty (ordinate) for a given return period (abscissa) for 4-day (left) and 1-day (right) precipitation for station Binn. The return level estimates are given by the blue line, while their 95% confidence bounds are colored in green.

Brig
Return level plots showing, with lines, the best estimate for the return levels and the corresponding 95% confidence intervals.
Plots of return levels and their uncertainty (ordinate) for a given return period (abscissa) for 4-day (left) and 1-day (right) precipitation for station Brig. The return level estimates are given by the blue line, while their 95% confidence bounds are colored in green.

Càmedo
Left: table listing the dates of the 10 highest annual 4-day precipitation maxima with the corresponding precipitation sums. Right: return level plot for 1-day precipitation, showing, with lines, the best estimate for the return levels and the corresponding 95% confidence intervals.
Left: 10 highest annual 4-day precipitation maxima at station Càmedo between 1961 and 2014. Precipitation sums are calculated from 05:40 UTC of one day to 05:40 UTC of the following day. The date indicates the last entire day over which the precipitation is summed. Right: plot of return levels and their uncertainty (ordinate) for a given return period (abscissa) for 1-day precipitation. The return level estimates are given by the blue line, while their 95% confidence bounds are colored in green.

Cevio
Return level plots showing, with lines, the best estimate for the return levels and the corresponding 95% confidence intervals.
Plots of return levels and their uncertainty (ordinate) for a given return period (abscissa) for 4-day (left) and 1-day (right) precipitation for station Cevio. The return level estimates are given by the blue line, while their 95% confidence bounds are colored in green.

Cimetta
Tables listing the dates of the 10 highest annual 4-day and 1-day precipitation maxima with the corresponding precipitation sums.
10 highest annual 4-day (left) and 1-day (right) precipitation maxima at station Cimetta between 1982 and 2014. Precipitation sums are calculated from 05:40 UTC of one day to 05:40 UTC of the following day. The date indicates the last entire day over which the precipitation is summed.

Locarno/Monti
Return level plots showing, with lines, the best estimate for the return levels and the corresponding 95% confidence intervals.
Plots of return levels and their uncertainty (ordinate) for a given return period (abscissa) for 4-day (left) and 1-day (right) precipitation for station Locarno/Monti. The return level estimates are given by the blue line, while their 95% confidence bounds are colored in green.

Lugano
Return level plots showing, with lines, the best estimate for the return levels and the corresponding 95% confidence intervals.
Plots of return levels and their uncertainty (ordinate) for a given return period (abscissa) for 4-day (left) and 1-day (right) precipitation for station Lugano. The return level estimates are given by the blue line, while their 95% confidence bounds are colored in green.

Magadino/Cadenazzo
Tables listing the dates of the 10 highest annual 4-day and 1-day precipitation maxima with the corresponding precipitation sums.
10 highest annual 4-day (left) and 1-day (right) precipitation maxima at station Magadino/Cadenazzo between 1961 and 2014. Precipitation sums are calculated from 05:40 UTC of one day to 05:40 UTC of the following day. The date indicates the last entire day over which the precipitation is summed.

Mosogno
Tables listing the dates of the 10 highest annual 4-day and 1-day precipitation maxima with the corresponding precipitation sums.
10 highest annual 4-day (left) and 1-day (right) precipitation maxima at station Mosogno between 1961 and 2014. Precipitation sums are calculated from 05:40 UTC of one day to 05:40 UTC of the following day. The date indicates the last entire day over which the precipitation is summed.

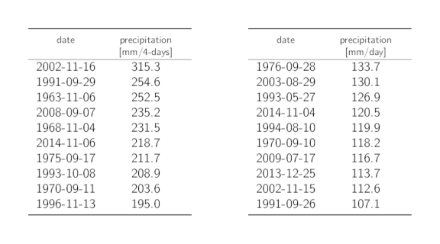
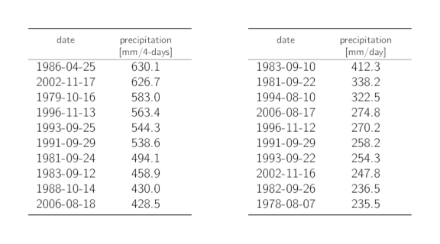
Note: The reliability of the results for 1-day precipitation is poor, hence no extreme value analysis is given.

Piotta
Tables listing the dates of the 10 highest annual 4-day and 1-day precipitation maxima with the corresponding precipitation sums.
10 highest annual 4-day (left) and 1-day (right) precipitation maxima at station Piotta between 1980 and 2014. Precipitation sums are calculated from 05:40 UTC of one day to 05:40 UTC of the following day. The date indicates the last entire day over which the precipitation is summed.

Robièi
Tables listing the dates of the 10 highest annual 4-day and 1-day precipitation maxima with the corresponding precipitation sums.
10 highest annual 4-day (left) and 1-day (right) precipitation maxima at station Robièi between 1992 and 2014. Precipitation sums are calculated from 05:40 UTC of one day to 05:40 UTC of the following day. The date indicates the last entire day over which the precipitation is summed.

S. Bernardino
Left: return level plot for 4-day precipitation, showing, with lines, the best estimate for the return levels and the corresponding 95% confidence intervals. Right: table listing the dates of the 10 highest annual 1-day precipitation maxima with the corresponding precipitation sums.
Left: plot of return levels and their uncertainty (ordinate) for a given return period (abscissa) for 4-day precipitation for station S. Bernardino. The return level estimates are given by the blue line, while their 95% confidence bounds are colored in green. Right: 10 highest annual 1-day precipitation maxima between 1968 and 2014. Precipitation sums are calculated from 05:40 UTC of one day to 05:40 UTC of the following day.

Simplon-Dorf
Return level plots showing, with lines, the best estimate for the return levels and the corresponding 95% confidence intervals.
Plots of return levels and their uncertainty (ordinate) for a given return period (abscissa) for 4-day (left) and 1-day (right) precipitation for station Simplon-Dorf. The return level estimates are given by the blue line, while their 95% confidence bounds are colored in green.

Stabio
Tables listing the dates of the 10 highest annual 4-day and 1-day precipitation maxima with the corresponding precipitation sums.
10 highest annual 4-day (left) and 1-day (right) precipitation maxima at station Stabio between 1982 and 2014. Precipitation sums are calculated from 05:40 UTC of one day to 05:40 UTC of the following day. The date indicates the last entire day over which the precipitation is summed.

Ulrichen
Tables listing the dates of the 10 highest annual 4-day and 1-day precipitation maxima with the corresponding precipitation sums.
10 highest annual 4-day (left) and 1-day (right) precipitation maxima at station Ulrichen between 1981 and 2014. Precipitation sums are calculated from 05:40 UTC of one day to 05:40 UTC of the following day. The date indicates the last entire day over which the precipitation is summed.