Service Navigation
Search
Out of the ten stations measuring hourly precipitation that recorded the highest cumulated precipitation over the duration of the event, nine are located in Ticino, since precipitation amounts in that region are usually larger than in the other regions of Switzerland. The station which measured the highest 4-day precipitation is Robièi (363.2 mm), located in north-western Ticino.
As the hyetographs show, the precipitation between 22 and 25 September 1993 fell almost continuously and with varying hourly intensity. The highest intensities were measured at stations Stabio (21.9 mm/h), Locarno/Monti (20.5 mm/h), Lugano (14.7 mm/h) and Magadino/Cadenazzo (14.3 mm/h).
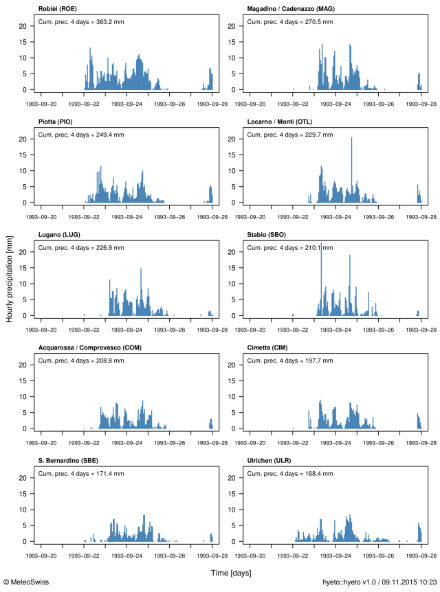
The hyetographs display hourly precipitation starting 2 days before the beginning of the event (20 September 1993) and ending 2 days after the end of the event (27 September 1993). The hourly precipitation [mm] is represented by the vertical blue bars and the date is given on the time axis, where each day begins at 00 UTC. The cumulated precipitation over the duration of the event (4 days) is indicated in the top left corner of the plots and corresponds to the precipitation measured between 22 September 1993, 05:40 UTC and 26 September 1993, 05:40 UTC.
Comparison with other heavy precipitation events
The plots in the infoboxes below show the event of 22 to 25 September 1993 compared with other events for stations Robièi and Ulrichen. Although large precipitation amounts fell during this event, it was not the most intense 72-hour precipitation event measured at both stations in autumn between 1981 and 2014. The maximum cumulated precipitation measured over 72 hours amounts to 359 mm and 156.1 mm respectively, which corresponds to rankings of respectively 2 and 5 compared to other 72-hour precipitation sums measured at those stations.
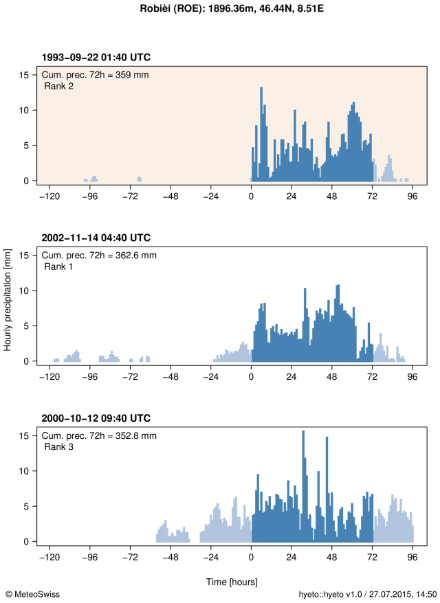
Comparison of the event (beige background) with two other large 72-hour precipitation sums (white background) that were measured in Robièi (Ticino) in autumn (SON) between 1990 and 2014. The hourly precipitation [mm] is represented by vertical bars: blue during, and grey before and after the 72-hour intervals. The dates and times corresponding to the beginning of the 72-hour intervals are given above the plots and indicated by 0 on the time axis. The rank indicates the ranking of the events compared to other 72-hour precipitation sums at that station.
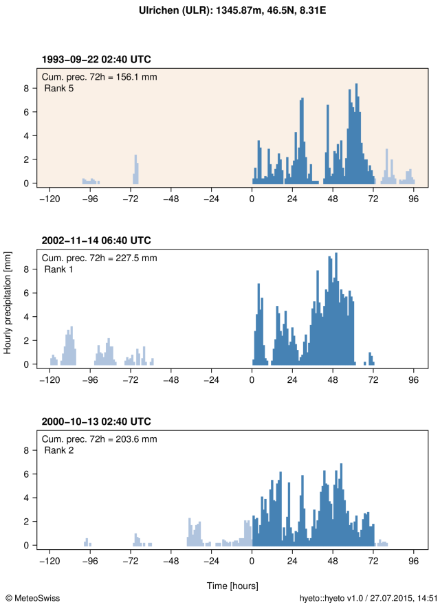
Comparison of the event (beige background) with two other large 72-hour precipitation sums (white background) that were measured at station Ulrichen (Upper Valais) in autumn (SON) between 1981 and 2014. The hourly precipitation [mm] is represented by vertical bars: blue during, and grey before and after the 72-hour intervals. The dates and times corresponding to the beginning of the 72-hour intervals are given above the plots and indicated by 0 on the time axis. The rank indicates the ranking of the events compared to other 72-hour precipitation sums at that station.
Moving sums of hourly precipitation cumulated over a duration interval of 72 hours are used in order to determine the highest 72-hour precipitation sums at the given stations and to determine the ranking of the event of September 1993 compared to other precipitation sums of same duration for the same season (SON). A large 72-hour precipitation sum does not always result from one long-lasting precipitation event, but can also result from two successive precipitation events separated by a certain amount of hours. Note that the starting time of the duration interval over which the cumulated precipitation is the highest can differ from one station to another.
Automatic stations measuring hourly precipitation were used to produce the hyetographs presented above. These stations are not always located, however, where the highest precipitation falls, and the daily sums are sometimes lower than those measured at other stations in the affected area that measure daily precipitation only.
| Date | ROE | MSG | CMD | CEV |
|---|---|---|---|---|
| 22.09.1993 | 111 | 254.3 | 192.2 | 115.1 |
| 23.09.1993 | 95.2 | 137.2 | 162.3 | 111.9 |
| 24.09.1993 | 143 | 132 | 169.1 | 145.8 |
| 25.09.1993 | 14 | 20.8 | 20.2 | 105.8 |
| 3-day sum (22-24.09.1993) | 349.2 | 523.5 | 523.6 | 372.8 |
| 4-day sum (22-25.09.1993) | 363.2 | 544.3 | 543.8 | 478.6 |
Precipitation sum [mm] over 1, 3 and 4 day(s) at stations in Ticino measuring hourly precipitation (Robièi, ROE) and daily precipitation (Mosogno (MSG), Càmedo (CMD) and Cevio (CEV)). The sum is always calculated from 05:40 UTC of a given day to 05:40 UTC of the following day. Source: MeteoSwiss
| Date | ULR | BIN | SIM | BRI |
|---|---|---|---|---|
| 22.09.1993 | 34.1 | 83.9 | 73.6 | 15.8 |
| 23.09.1993 | 45.2 | 110 | 110.2 | 34.1 |
| 24.09.1993 | 75.3 | 161.5 | 182.2 | 45 |
| 25.09.1993 | 13.8 | 26 | 8.8 | 15 |
| 3-day sum (22-24.09.1993) | 154.6 | 355.4 | 366 | 94.9 |
| 4-day sum (22-25.09.1993) | 168.4 | 381.4 | 374.8 | 109.9 |
Precipitation sum [mm] over 1, 3 and 4 day(s) at stations in the Upper Valais measuring hourly precipitation (Ulrichen, ULR) and daily precipitation (Binn (BIN), Simplon-Dorf (SIM) and Brig (BRI)). The sum is always calculated from 05:40 UTC of a given day to 05:40 UTC of the following day. Source: MeteoSwiss
For the stations measuring daily precipitation, the precipitation recorded between 22 and 24 September 1993 was also not the highest 3-day sum ever measured, but is in the top 5 of the most intense 3-day precipitation. For example, the precipitation measured between 22 and 24 September at stations Binn (355.4 mm) and Simplon-Dorf (366 mm) corresponds to the second highest 3-day sum measured between 1981 and 2014, all seasons considered. Another event brought higher precipitation at those stations in October 2002, with a maximum 3-day sum of respectively 504.4 mm and 602.8 mm on 13-15 October.
For the stations in Ticino (Cevio, Mosogno, Càmedo), the event of 22-25 September corresponds respectively to the third, fourth and fifth highest 3-day precipitation sum measured between 1981 and 2014, all seasons considered. Other events, which mostly took place in autumn, brought higher precipitation. The largest 3-day sum was measured at all three stations between 14 and 16 November 2002 with 614.6 mm at Mosogno, 611.3 mm at Càmedo and 494 mm at Cevio.
