Contents area

Extreme value analyses

Extreme value analyses for stations located within the affected regions of the precipitation event of 19-23 August 2005.

Footer

Top bar Navigation

Swiss federal authorities

Service Navigation

Return periods of the 5-day precipitation for 19-23 August 2005

This event mostly brought extraordinary rainfall amounts over the northern flank of the Alps, the Prealps and the Plateau. During the 5 days the event lasted, the stations located in those regions measured precipitation amounts corresponding to return periods of up to and more than 100 years.

The rainfall amounts measured between 19 and 23 August 2005 (i.e. over 5 days) are the rarest at stations located in the cantons of Bern and Luzern, in particular in the regions of Interlaken-Oberhasli (Meiringen: 233 mm; Grindelwald: 181.1 mm), Entlebuch (Escholzmatt: 254.9 mm; Machbach: 244.5 mm; Flühli: 256.7 mm), the lower Simmental (Wimmis: 192.1 mm; Erlenbach im Simmental: 203.2 mm) and central Switzerland (Engelberg: 214.6 mm). Very rare rainfall for this event was also recorded at station Weesen in the canton of St. Gallen (287.9 mm). For all these stations, the 5-day precipitation has a corresponding return period of more than 100 years.

Map of Switzerland with, in colored circles, the return periods of the 5-day precipitation between 19 and 23 August 2005.
Map of the return periods (in years) of the 5-day precipitation for 19-23 August 2005

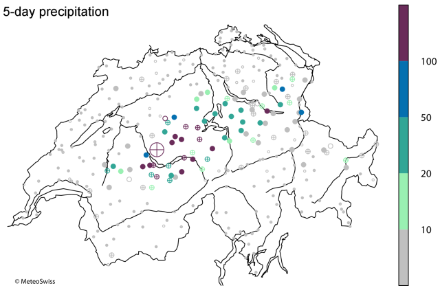
The 5-day precipitation is measured between 19 August 2005, 05:40 UTC and 24 August 2005, 05:40 UTC. The return periods are based on the generalized extreme value distribution estimated from the annual 5-day precipitation maxima during the period 1961-2010. The size of the circles is proportional to the value of the return period. The filling of the circles indicates the reliability of the statistics: good (filled circle), questionable (circle with cross) and poor (empty circle).

Return periods of the largest 4, 3, 2 and 1-day precipitation

The maps of the return periods of the largest 4, 3, 2 and 1-day precipitation show similar patterns to the map for 5-day precipitation; for most of the stations in the concerned regions the measured return levels correspond to return periods of up to 100 years and more. As for 5-day precipitation, the return periods for these precipitation sums are higher for stations located in the regions of the Simmental, Haslital and Entlebuch (20 to >100 years) and a slightly lower in the eastern part of Switzerland (mainly 10-100 years).

While the largest precipitation of the event occurred over most of Switzerland on 21 and 22 August, i.e. within more or less 48 hours, the return periods of the largest 1, 2 and 3-day precipitation seem to be slightly lower than those of the largest 4-day precipitation and fewer stations show very high return levels (> 100 years) for these precipitation sums. The stations that do show such return levels for one or more of these sums are those mentioned earlier which are located in the Simmental, Haslital and Entlebuch, as well as a few stations located further to the east in central Switzerland and in the cantons of Luzern and Appenzell. Only one station (Wimmis, Simmental) measured rainfall amounts corresponding to return periods of more than 100 years for all the different precipitation sums (i.e. 1, 2, 3 and 4-day precipitation).

The fact that return periods of 1, 2 and 3-day precipitation tend to be lower than for 4 and 5-day precipitation suggests that not only the large amounts of rain that fell during the most intense phase of the event on 21 and 22 August contributed to its severity, but also the precipitation preceding and following this maximum.

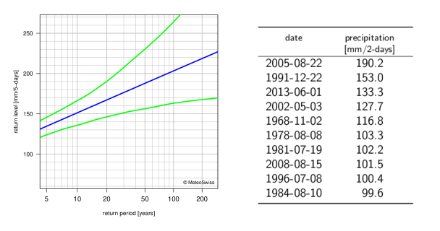
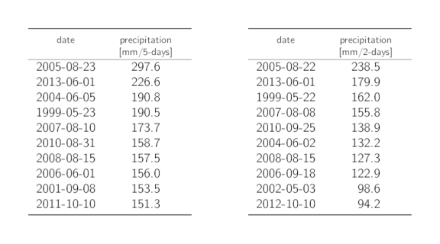
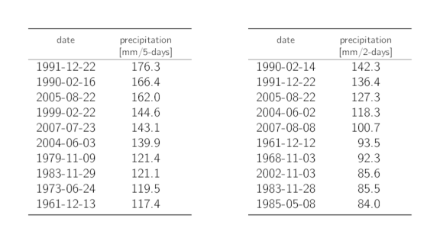
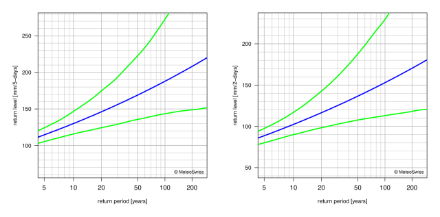
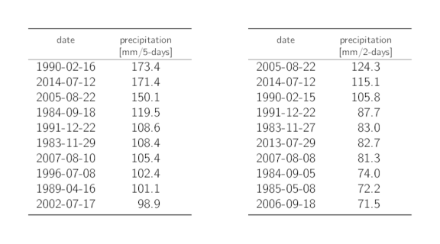
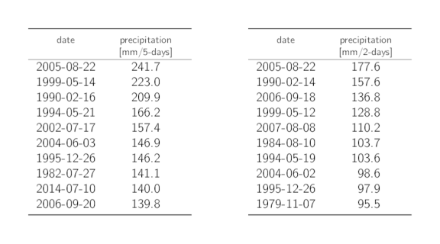
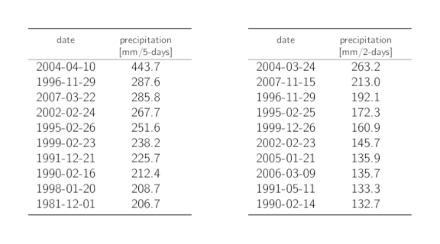
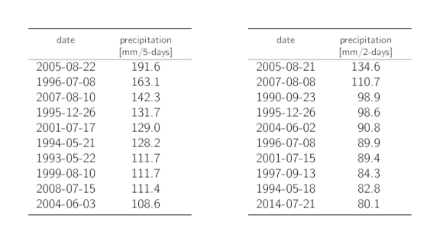
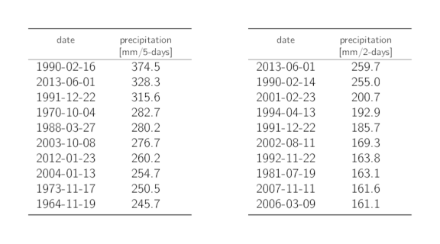
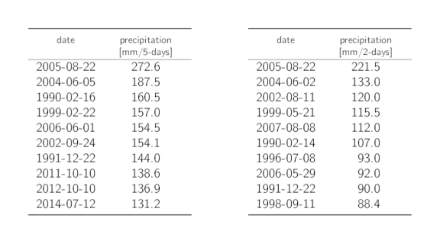
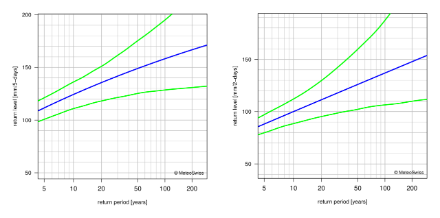
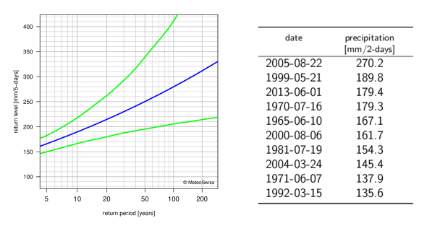
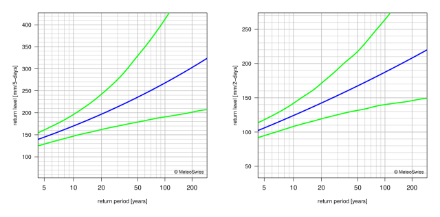
Extreme value analyses for 5-day and 2-day precipitation

This section provides the extreme value analyses for the stations presented in the section Hyetographs. The statistics are based on the period 1961-2010. Return level plots of 5-day and 2-day precipitation maxima are shown when the statistics are reliable. When the statistics are not reliable or when the length of the records is too short, tables of the ten highest precipitation maxima for the period 1961-2014 or between the beginning of the measurements and 2014 are shown instead. In addition, PDFs of the extreme value analyses are given when the reliability of the results is good or questionable.

Engelberg
Left: return level plot for 5-day precipitation, showing, with lines, the best estimate for the return levels and the corresponding 95% confidence intervals. Right: table listing the dates of the 10 highest annual 2-day precipitation maxima with the corresponding precipitation sums.
Left: plot of return levels and their uncertainty (ordinate) for a given return period (abscissa) for 5-day precipitation for station Engelberg. The return level estimates are given by the blue line, while their 95% confidence bounds are colored in green. Right: 10 highest annual 2-day precipitation maxima between 1961 and 2014. Precipitation sums are calculated from 05:40 UTC of one day to 05:40 UTC of the following day. The date indicates the last entire day over which the precipitation is summed.

Gersau
Tables listing the dates of the 10 highest annual 5-day and 2-day precipitation maxima with the corresponding precipitation sums.
10 highest annual 5-day (left) and 2-day (right) precipitation maxima at station Gersau between 1999 and 2014. Precipitation sums are calculated from 05:40 UTC of one day to 05:40 UTC of the following day. The date indicates the last entire day over which the precipitation is summed.

Interlaken
Table listing the dates of the 10 highest annual 5-day and 2-day precipitation maxima with the corresponding precipitation sums.
10 highest annual 5-day (left) and 2-day (right) precipitation maxima at station Interlaken between 1961 and 2014. Precipitation sums are calculated from 05:40 UTC of one day to 05:40 UTC of the following day. The date indicates the last entire day over which the precipitation is summed.

Luzern
Return level plots showing, with lines, the best estimate for the return levels and the corresponding 95% confidence intervals.
Plots of return levels and their uncertainty (ordinate) for a given return period (abscissa) for 5-day (left) and 2-day (right) precipitation for station Luzern. The return level estimates are given by the blue line, while their 95% confidence bounds are colored in green.

Le Moléson
Tables listing the dates of the 10 highest annual 5-day and 2-day precipitation maxima with the corresponding precipitation sums.
10 highest annual 5-day (left) and 2-day (right) precipitation maxima at station Le Moléson between 1983 and 2014. Precipitation sums are calculated from 05:40 UTC of one day to 05:40 UTC of the following day. The date indicates the last entire day over which the precipitation is summed.

Napf
Tables listing the dates of the 10 highest annual 5-day and 2-day precipitation maxima with the corresponding precipitation sums.
10 highest annual 5-day (left) and 2-day (right) precipitation maxima at station Napf between 1978 and 2014. Precipitation sums are calculated from 05:40 UTC of one day to 05:40 UTC of the following day. The date indicates the last entire day over which the precipitation is summed.

Pilatus
Tables listing the dates of the 10 highest annual 5-day and 2-day precipitation maxima with the corresponding precipitation sums.
10 highest annual 5-day (left) and 2-day (right) precipitation maxima at station Pilatus between 1981 and 2014. Precipitation sums are calculated from 05:40 UTC of one day to 05:40 UTC of the following day. The date indicates the last entire day over which the precipitation is summed.

Plaffeien
Tables listing the dates of the 10 highest annual 5-day and 2-day precipitation maxima with the corresponding precipitation sums.
10 highest annual 5-day (left) and 2-day (right) precipitation maxima at station Plaffeien between 1990 and 2014. Precipitation sums are calculated from 05:40 UTC of one day to 05:40 UTC of the following day. The date indicates the last entire day over which the precipitation is summed.

Säntis
Tables listing the dates of the 10 highest annual 5-day and 2-day precipitation maxima with the corresponding precipitation sums.
10 highest annual 5-day (left) and 2-day (right) precipitation maxima at station Säntis between 1961 and 2014. Precipitation sums are calculated from 05:40 UTC of one day to 05:40 UTC of the following day. The date indicates the last entire day over which the precipitation is summed.

Stöckalp
Tables listing the dates of the 10 highest annual 5-day and 2-day precipitation maxima with the corresponding precipitation sums.
10 highest annual 5-day (left) and 2-day (right) precipitation maxima at station Stöckalp between 1985 and 2014. Precipitation sums are calculated from 05:40 UTC of one day to 05:40 UTC of the following day. The date indicates the last entire day over which the precipitation is summed.

Vaduz
Return level plots showing, with lines, the best estimate for the return levels and the corresponding 95% confidence intervals.
Plots of return levels and their uncertainty (ordinate) for a given return period (abscissa) for 5-day (left) and 2-day (right) precipitation for station Vaduz. The return level estimates are given by the blue line, while their 95% confidence bounds are colored in green.

Weesen
Left: return level plot for 5-day precipitation, showing, with lines, the best estimate for the return levels and the corresponding 95% confidence intervals. Right: table listing the dates of the 10 highest annual 2-day precipitation maxima with the corresponding precipitation sums.
Left: plot of return levels and their uncertainty (ordinate) for a given return period (abscissa) for 5-day precipitation for station Weesen. The return level estimates are given by the blue line, while their 95% confidence bounds are colored in green. Right: 10 highest annual 2-day precipitation maxima between 1961 and 2014. Precipitation sums are calculated from 05:40 UTC of one day to 05:40 UTC of the following day. The date indicates the last entire day over which the precipitation is summed.

Weissfluhjoch
Return level plots showing, with lines, the best estimate for the return levels and the corresponding 95% confidence intervals.
Plots of return levels and their uncertainty (ordinate) for a given return period (abscissa) for 5-day (left) and 2-day (right) precipitation for station Weissfluhjoch. The return level estimates are given by the blue line, while their 95% confidence bounds are colored in green.