Service Navigation
Search
The ten stations measuring hourly precipitation that recorded the highest cumulated precipitation between 19 and 23 August 2005 are scattered over Switzerland and located on the Alpine north slope, as well as in the northern and central Grisons. For most of these stations, precipitation related to thunderstorms can be seen in the hyetographs on 19 August in the afternoon or evening with a short peak of more or less intense precipitation. The most remarkable example is given by station Plaffeien (Sense Oberland), at which 22.3 mm was recorded in three hours, most of which (20.8 mm) fell within one hour.
Between 20 and 23 August, the precipitation fell more continuously, sometimes reaching high hourly intensities. For example, a maximum of 18.6 mm/h was measured at station Säntis (eastern Alpine north slope) and 15.3 mm/h at station Engelberg (central Alpine north slope). The two largest 5-day cumulated precipitation sums were measured at stations Napf (Emmental, 235.8 mm) and Säntis (231.4 mm).
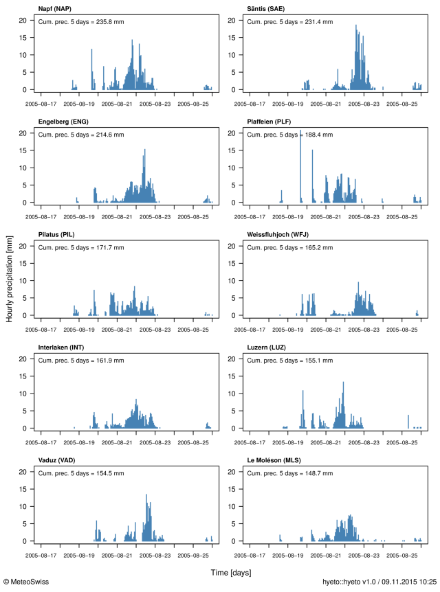
The hyetographs display hourly precipitation starting 2 days before the beginning of the event (17 August 2005) and ending 2 days after the end of the event (25 August 2005). The hourly precipitation [mm] is represented by the vertical blue bars and the date is given on the time axis, where each day begins at 00 UTC. The cumulated precipitation over the duration of the event (5 days) is indicated in the top left corner of the plots and corresponds to the precipitation measured between 19 August 2005, 05:40 UTC and 24 August 2005, 05:40 UTC.
Comparison with other heavy precipitation events
The plots in the infoboxes below show the event of 19 to 23 August 2005 compared with other events for stations Engelberg, Napf, Plaffeien and Säntis. Since the precipitation amounts were particularly high on 21 and 22 August, the 48-hour precipitation sum was selected for the comparison. For all four stations, the precipitation accumulated between 20 and 22 August is the highest 48-hour precipitation sum ever measured in summer between 1981 and 2014, with 215.2 mm measured in 48 hours at station Säntis, 192.9 mm at station Napf, 190.8 mm at station Engelberg and 144 mm at station Plaffeien.
Although at stations Napf and Plaffeien the precipitation fallen during this event also represents the highest 2-day precipitation measured since 1978 and 1989 respectively, all seasons considered, a higher sum was recorded once at station Engelberg since measurements began in 1864 (226.5 mm on 30-31 July 1874).
For station Säntis, the 2-day precipitation measured during the event corresponded at that time to the highest 2-day summer precipitation sum measured since 1882, but higher precipitation amounts had been recorded in other seasons (e.g. 290 mm on 2-3 November 1921). More recently (31 Mai to 1 June 2013), a new summer record was measured at that station with 259.7 mm of precipitation in 2 days. It is not, however, represented in the hyetographs below that show summer (JJA) precipitation, since half of the event occurred in spring (MAM)
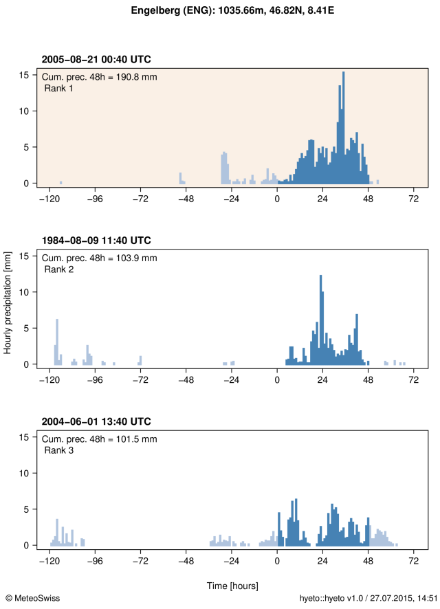
Comparison of the event (beige background) with two other large 48-hour precipitation sums (white background) that were measured at station Engelberg (central Alpine north slope) in summer (JJA) between 1982 and 2014. The hourly precipitation [mm] is represented by vertical bars: blue during, and grey before and after the 48-hour intervals. The dates and times corresponding to the beginning of the 48-hour intervals are given above the plots and indicated by 0 on the time axis. The rank indicates the ranking of the events compared to other 48-hour precipitation sums at that station.
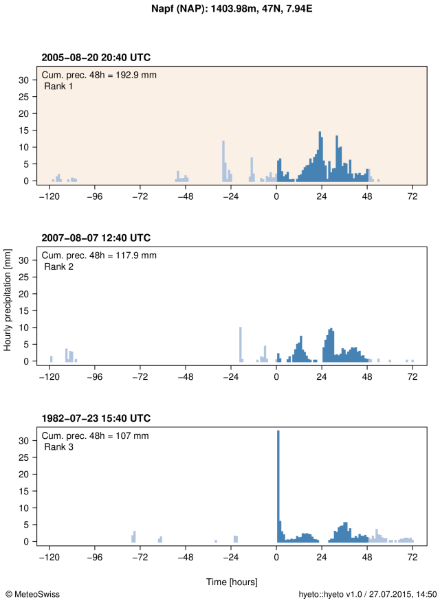
Comparison of the event (beige background) with two other large 48-hour precipitation sums (white background) that were measured at station Napf (Emmental) in summer (JJA) between 1981 and 2014. The hourly precipitation [mm] is represented by vertical bars: blue during, and grey before and after the 48-hour intervals. The dates and times corresponding to the beginning of the 48-hour intervals are given above the plots and indicated by 0 on the time axis. The rank indicates the ranking of the events compared to other 48-hour precipitation sums at that station.
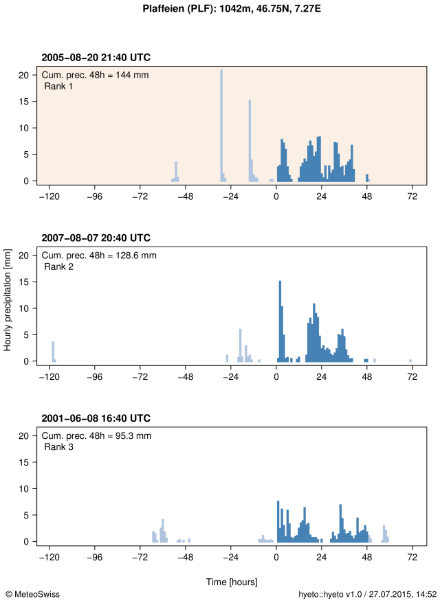
Comparison of the event (beige background) with two other large 48-hour precipitation sums (white background) that were measured at station Plaffeien (Sense Oberland) in summer (JJA) between 1989 and 2014. The hourly precipitation [mm] is represented by vertical bars: blue during, and grey before and after the 48-hour intervals. The dates and times corresponding to the beginning of the 48-hour intervals are given above the plots and indicated by 0 on the time axis. The rank indicates the ranking of the events compared to other 48-hour precipitation sums at that station.
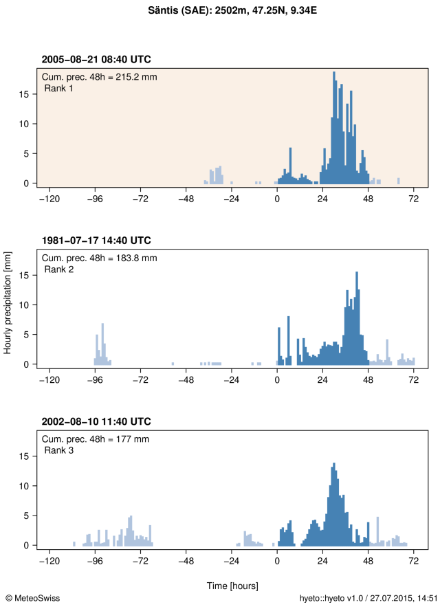
Comparison of the event (beige background) with two other large 48-hour precipitation sums (white background) that were measured at station Säntis (eastern Alpine north slope) in summer (JJA) between 1981 and 2014. The hourly precipitation [mm] is represented by vertical bars: blue during, and grey before and after the 48-hour intervals. The dates and times corresponding to the beginning of the 48-hour intervals are given above the plots and indicated by 0 on the time axis. The rank indicates the ranking of the events compared to other 48-hour precipitation sums at that station.
Moving sums of hourly precipitation cumulated over a duration interval of 48 hours are used in order to determine the highest 48-hour precipitation sums at the given stations and to determine the ranking of the event of August 2005 compared to other precipitation sums of same duration for the same season (JJA). A large 48-hour precipitation sum does not always result from one long-lasting precipitation event, but can also result from two successive precipitation events separated by a certain amount of hours. Note that the starting time of the duration interval over which the cumulated precipitation is the highest can differ from one station to another.
Automatic stations measuring hourly precipitation were used to produce the hyetographs presented above. These stations are not always located, however, where the highest precipitation falls, and the daily sums are sometimes lower than those measured at other stations in the affected area that measure daily precipitation only.
Precipitation sum [mm] over 1, 2 and 5 day(s) at stations measuring hourly precipitation (Säntis, SAE) and daily precipitation (Weesen (WEE), Gersau (GES) and Stöckalp (STP)). The sum is always calculated from 05:40 UTC of a given day to 05:40 UTC of the following day. Source: MeteoSwiss
| Date | SAE | WEE | GES | STP |
|---|---|---|---|---|
| 19.08.2005 | 13.1 | 9.7 | 34.1 | 13.5 |
| 20.08.2005 | 0.3 | 1 | 23.7 | 15.1 |
| 21.08.2005 | 21.2 | 28.4 | 89.3 | 96 |
| 22.08.2005 | 186.7 | 241.8 | 149.2 | 125.5 |
| 23.08.2005 | 10.1 | 7 | 1.3 | 0 |
| 2-day sum (21-22.08.2005) | 207.9 | 270.2 | 238.5 | 221.5 |
| 5-day sum (19-23.08.2005) | 231.4 | 287.9 | 297.6 | 250.1 |
For the three stations measuring daily precipitation (Weesen, Stöckalp and Gersau), the precipitation measured on 20-22 August also corresponds to the highest 2-day precipitation measured since 1888, 1984 and 1998 respectively, all seasons considered.
