Service Navigation
Search
Return periods of the 1-day precipitation for 14 November 2002
This event brought rare precipitation amounts over western and eastern Switzerland. In western Switzerland, the rainfall measured on 14 November 2002 was the rarest at station Genève-Aire (93.5 mm), with a return level corresponding to a return period between 50 and 100 years. It is the highest 1-day precipitation ever measured at that station between 1981 and 2014.
The precipitation measured at stations Jussy (Geneva, 82 mm) and Valeyres-sous-Rances (Vaud, 75.3 mm) was also quite rare, corresponding to 20 to 50-year events.
In the Grisons, rare rainfall amounts were also measured on 14 November, with corresponding return periods of up to 100 years. The precipitation which affected that region between 13 and 17 November is presented as another event for which the description can be found here: 13-17 November 2002.
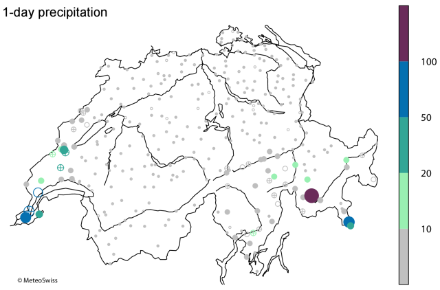
The 1-day precipitation is measured between 14 November 2002, 05:40 UTC and 15 November 2002, 05:40 UTC. The return periods are based on the generalized extreme value distribution estimated from the annual 1-day precipitation maxima during the period 1961-2010. The size of the circles is proportional to the value of the return period. The filling of the circles indicates the reliability of the statistics: good (filled circle), questionable (circle with cross) and poor (empty circle).
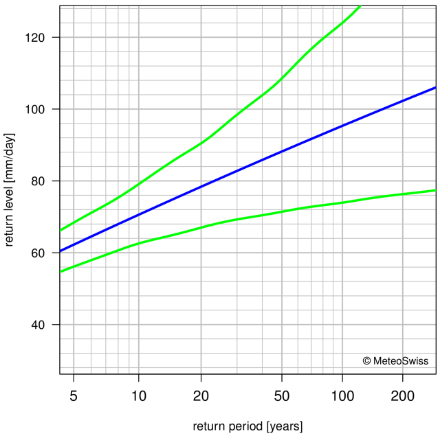
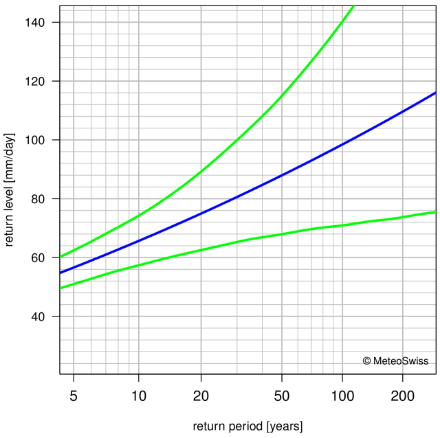
Extreme value analyses for 1-day precipitation
This section provides the extreme value analyses for the stations presented in the section Hyetographs. The statistics are based on the period 1961-2010. Return When the statistics are not reliable or when the length of the records is too short, a table of the ten highest precipitation maxima for the period 1961-2014 or between the beginning of the measurements and 2014 is shown instead. In addition, PDFs of the extreme value analyses are given when the reliability of the results is good or questionable.level plots of 1-day precipitation maxima are shown when the statistics are reliable.
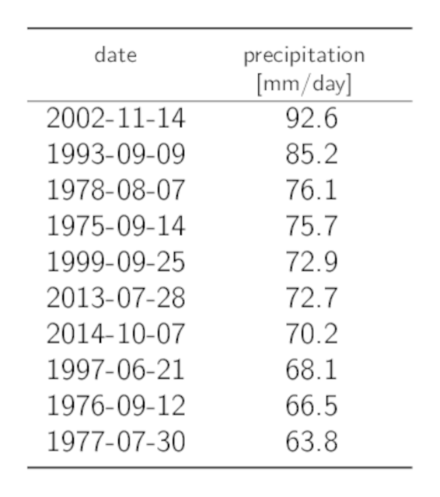
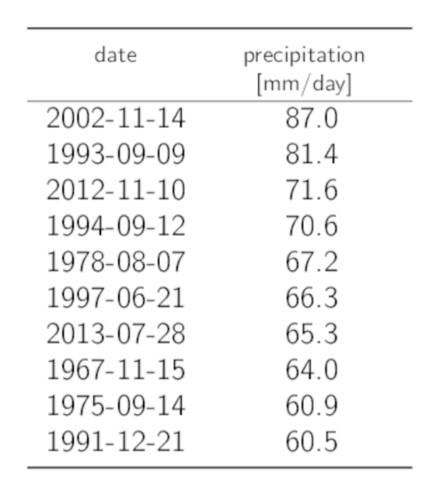
Note: The reliability of the results for 1-day precipitation is poor, hence no extreme value analysis is given.