Service Navigation
Search
Since there are only two stations measuring hourly precipitation located in the region of Geneva, hyetographs are only shown for these two stations. During this event, station Genève-Cointrin recorded the highest 1-day precipitation (92.6 mm). The precipitation fell in two successive phases; the first occurred on 14 November 2002 between 04:40 and 15:40 UTC and the second between 17:40 and 04:40 the following day. During those two phases, hourly maximum values of respectively 8.1 mm and 8.9 mm were measured.
Station Nyon/Changins measured even higher hourly intensities with maximums of 8.4 mm/h and 9.8 mm/h respectively during the two phases.
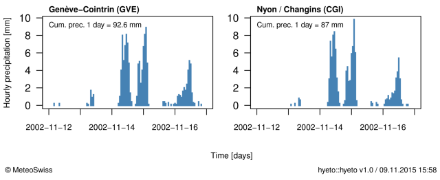
The hyetographs display hourly precipitation starting 2 days before the beginning of the event (12 November 2002) and ending 2 days after the end of the event (17 November 2002). The hourly precipitation [mm] is represented by the vertical blue bars and the date is given on the time axis, where each day begins at 00 UTC. The cumulated precipitation over the duration of the event (1 day) is indicated in the top left corner of the plots and corresponds to the precipitation measured between 14 November 2002, 05:40 UTC and 15 November 2002, 05:40 UTC.
Comparison with other heavy precipitation events
The plot in the infobox below shows the event of 14 to 15 November 2002 compared with other events for station Genève-Cointrin. For this station, this event was the highest 24-hour precipitation measured in autumn between 1981 and 2014, with 98.6 mm of cumulated precipitation.
It is not, however, the highest 24-hour precipitation sum that has been recorded at that station since the beginning of the measurements in 1770. Two other events brought much higher precipitation in 1827 (162 mm on 20 May) and 1888 (124 mm on 2 October).
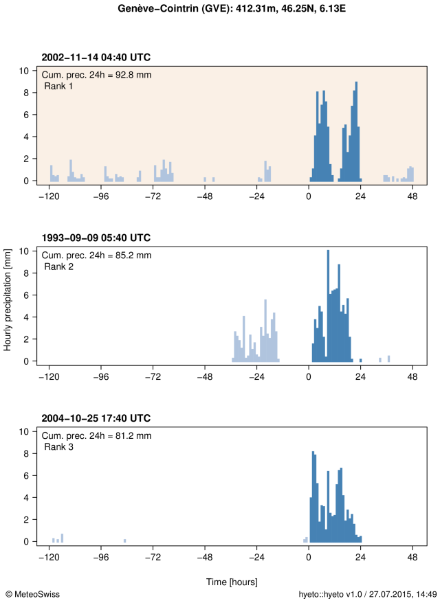
Comparison of the event (beige background) with two other large 24-hour precipitation sums (white background) that were measured at station Genève-Cointrin in autumn (SON) between 1981 and 2014. The hourly precipitation [mm] is represented by vertical bars: blue during, and grey before and after the 24-hour intervals. The dates and times corresponding to the beginning of the 24-hours intervals are given above the plots and indicated by 0 on the time axis. The rank indicates the ranking of the events compared to other 24-hour precipitation sums at the given station.
Moving sums of hourly precipitation cumulated over a duration interval of 24 hours are used in order to determine the most severe 24-hour precipitation sums at the given station and to determine the ranking of the event of November 2002 compared to other precipitation sums of same duration for the same season (SON).
Stations Genève-Cointrin and Nyon/Changins are the only stations located in the region of Geneva measuring hourly precipitation. However, there are also in that area stations that measure daily precipitation (see table below), at which high rainfall amounts were also measured during the event and represent the largest 1-day precipitation measured between 1981 and 2014, all seasons considered.
1-day precipitation [mm] at stations in the region of Geneva measuring hourly precipitation (Genève-Cointrin (GVE) and Nyon/Changins (CGI)) and daily precipitation (Genève-Aire (GEA) and Jussy (JUS)). The sum is always calculated from 05:40 UTC of a given day to 05:40 UTC of the following day. Source: MeteoSwiss
| Date | GVE | GEA | CGI | JUS |
|---|---|---|---|---|
| 14.11.2002 | 92.6 | 93.5 | 87 | 82 |