Contents area

Extreme value analyses

Extreme value analyses for stations located within the affected regions of the precipitation event of 13-17 November 2002.

Footer

Top bar Navigation

Swiss federal authorities

Service Navigation

Return periods of the 5-day precipitation for 13-17 November 2002

This event brought extraordinary precipitation amounts over the central Alpine north slope, Ticino and the Grisons. Between 13 and 17 November 2002, the stations located in these regions measured precipitation with return levels corresponding to return periods of up to and more than 100 years.

The precipitation amounts recorded during these 5 days were the rarest at stations Campocologno (252.9 mm) and Avers am Bach (267.8 mm) in the southern Grisons with return periods of more than 100 years.

In the region of Geneva, precipitation corresponding to a 10-20-year event were also measured. The precipitation that affected that region mostly took place on 14 November. It will not be described in this section but is presented as another event for which the description can be found here: 14-15 November 2002.

Map of Switzerland with, in colored circles, the return periods of the 5-day precipitation between 13 and 17 November 2002.
Map of the return periods (in years) of the 5-day precipitation for 13-17 November 2002

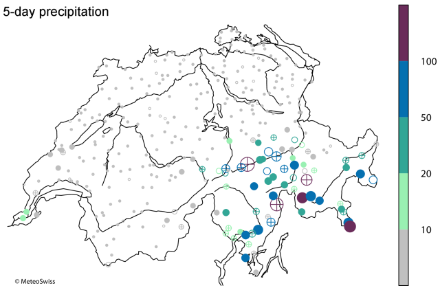
The 5-day precipitation is measured between 13 November 2002, 05:40 UTC and 18 November 2002, 05:40 UTC. The return periods are based on the generalized extreme value distribution estimated from the annual 5-day precipitation maxima during the period 1961-2010. The size of the circles is proportional to the value of the return period. The filling of the circles indicates the reliability of the statistics: good (filled circle), questionable (circle with cross) and poor (empty circle).

Return periods of the largest 4, 3, 2 and 1-day precipitation

Since the precipitation was particularly high over the interval of 3 days (14-16 November 2002), the return periods are even higher when considering the largest 4-day and 3-day precipitation than for the 5-day precipitation. Most stations in the affected regions measured precipitation with return levels corresponding to return periods of 50 to more than 100 years, in particular the stations located in the south-western Grisons.

Return periods are also high but a little lower for the largest 2-day precipitation. Very rare precipitation sums were measured in the south of the Grisons at stations Brusio-Piazzo (200.7 mm), Bivio (210.1 mm) and Zervreila (254.9 mm) with corresponding return periods of more than 100 years.

The largest 1-day precipitation, on the other hand, was not very rare. A few stations in the affected regions measured precipitation corresponding to a 10-50-year event and only two stations recorded return levels having a return period of 50-100 years (Brusio-Piazzo: 112.8 mm) or more than 100 years (Bivio: 123.8 mm).

Hence, while for most of the stations the daily precipitation amounts were not that extraordinary, the addition of such amounts over two and especially three days led to very rare precipitation sums which had consequences on the central Alpine north slope, in the Grisons and in Ticino.

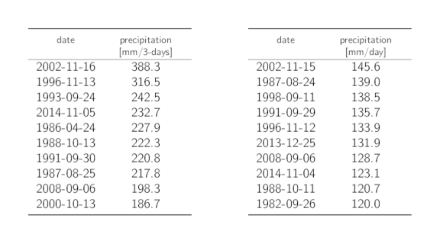
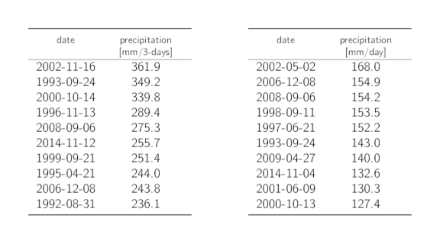
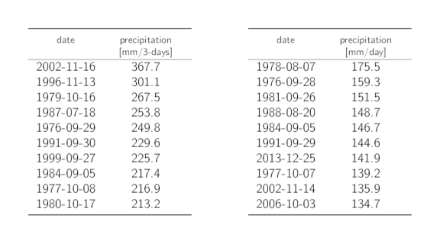
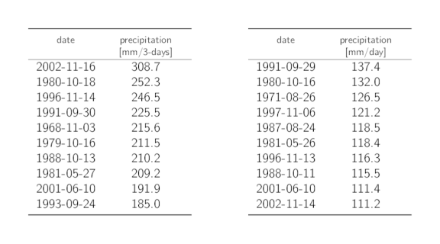
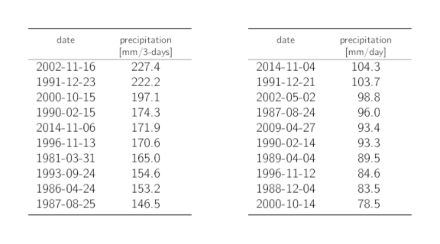
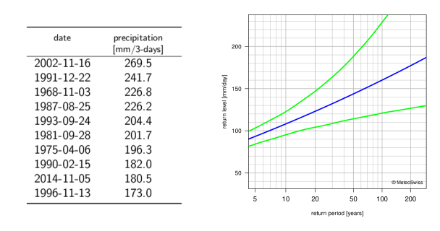
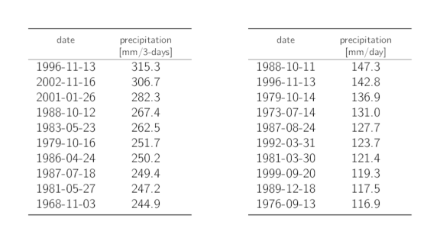
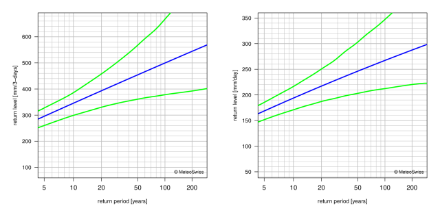
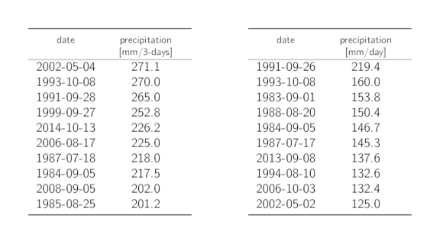
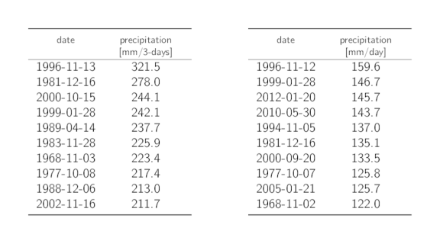
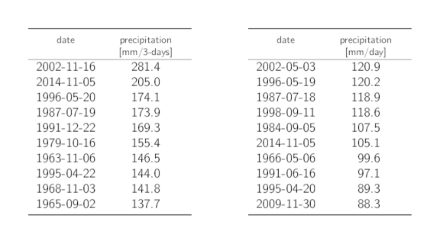
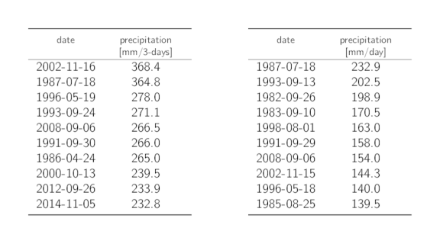
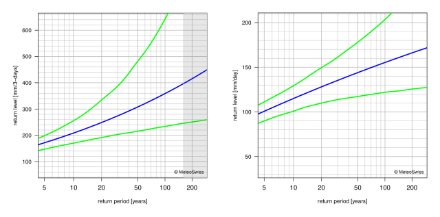
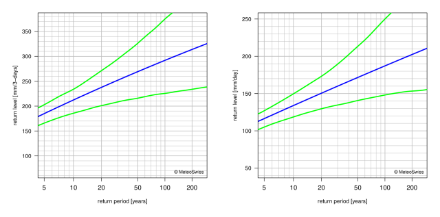
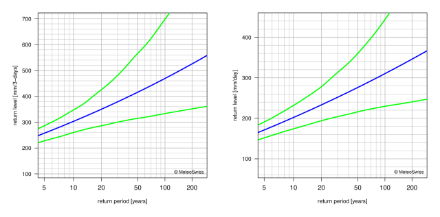
Extreme value analyses for 3-day and 1-day precipitation

This section provides the extreme value analyses for the stations presented in the section Hyetographs. The statistics are based on the period 1961-2010. Return level plots of 3-day and 1-day precipitation maxima are shown when the statistics are reliable. When the statistics are not reliable or when the length of the records is too short, tables of the ten highest precipitation maxima for the period 1961-2014 or between the beginning of the measurements and 2014 are shown instead. In addition, PDFs of the extreme value analyses are given when the reliability of the results is good or questionable.

Acquarossa/Comprovasco
Tables listing the dates of the 10 highest annual 3-day and 1-day precipitation maxima with the corresponding precipitation sums.
10 highest annual 3-day (left) and 1-day (right) precipitation maxima at station Acquarossa/Comprovasco between 1961 and 2014 (with 12 missing years in the time series). Precipitation sums are calculated from 05:40 UTC of one day to 05:40 UTC of the following day. The date indicates the last entire day over which the precipitation is summed.

Andermatt
Left: table listing the dates of the 10 highest annual 3-day precipitation maxima with the corresponding precipitation sums. Right: return level plot for 1-day precipitation, showing, with lines, the best estimate for the return levels and the corresponding 95% confidence intervals.
Left: 10 highest annual 3-day precipitation maxima at station Andermatt between 1961 and 2014. Precipitation sums are calculated from 05:40 UTC of one day to 05:40 UTC of the following day. The date indicates the last entire day over which the precipitation is summed. Right: plot of return levels and their uncertainty (ordinate) for a given return period (abscissa) for 1-day precipitation. The return level estimates are given by the blue line, while their 95% confidence bounds are colored in green.

Berninapass
Tables listing the dates of the 10 highest annual 3-day and 1-day precipitation maxima with the corresponding precipitation sums.
10 highest annual 3-day (left) and 1-day (right) precipitation maxima at station Berninapass between 1961 and 2014. Precipitation sums are calculated from 05:40 UTC of one day to 05:40 UTC of the following day. The date indicates the last entire day over which the precipitation is summed.

Cevio
Return level plots showing, with lines, the best estimate for the return levels and the corresponding 95% confidence intervals.
Plots of return levels and their uncertainty (ordinate) for a given return period (abscissa) for 3-day (left) and 1-day (right) precipitation for station Cevio. The return level estimates are given by the blue line, while their 95% confidence bounds are colored in green.

Cimetta
Tables listing the dates of the 10 highest annual 3-day and 1-day precipitation maxima with the corresponding precipitation sums.
10 highest annual 3-day (left) and 1-day (right) precipitation maxima at station Cimetta between 1982 and 2014. Precipitation sums are calculated from 05:40 UTC of one day to 05:40 UTC of the following day. The date indicates the last entire day over which the precipitation is summed.

Col du Grand St-Bernard
Tables listing the dates of the 10 highest annual 3-day and 1-day precipitation maxima with the corresponding precipitation sums.
10 highest annual 3-day (left) and 1-day (right) precipitation maxima at station Col du Grand St-Bernard between 1961 and 2014. Precipitation sums are calculated from 05:40 UTC of one day to 05:40 UTC of the following day. The date indicates the last entire day over which the precipitation is summed

Disentis/Sedrun
Tables listing the dates of the 10 highest annual 3-day and 1-day precipitation maxima with the corresponding precipitation sums.
10 highest annual 3-day (left) and 1-day (right) precipitation maxima at station Disentis/Sedrun between 1961 and 2014. Precipitation sums are calculated from 05:40 UTC of one day to 05:40 UTC of the following day. The date indicates the last entire day over which the precipitation is summed.

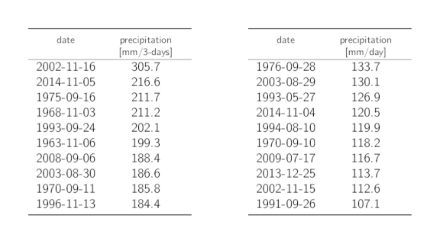
Note: The reliability of the results for 3-day precipitation is poor, hence no extreme value analysis is given.

Faido
Tables listing the dates of the 10 highest annual 3-day and 1-day precipitation maxima with the corresponding precipitation sums.
10 highest annual 3-day (left) and 1-day (right) precipitation maxima at station Faido between 1982 and 2014. Precipitation sums are calculated from 05:40 UTC of one day to 05:40 UTC of the following day. The date indicates the last entire day over which the precipitation is summed.

Göschenen
Tables listing the dates of the 10 highest annual 3-day and 1-day precipitation maxima with the corresponding precipitation sums.
10 highest annual 3-day (left) and 1-day (right) precipitation maxima at station Göschenen between 1961 and 2014. Precipitation sums are calculated from 05:40 UTC of one day to 05:40 UTC of the following day. The date indicates the last entire day over which the precipitation is summed.

Göscheneralp
Return level plots showing, with lines, the best estimate for the return levels and the corresponding 95% confidence intervals.
Plots of return levels and their uncertainty (ordinate) for a given return period (abscissa) for 3-day (left) and 1-day (right) precipitation for station Göscheneralp. The return level estimates are given by the blue line, while their 95% confidence bounds are colored in green.

Grono
Return level plots showing, with lines, the best estimate for the return levels and the corresponding 95% confidence intervals.
Plots of return levels and their uncertainty (ordinate) for a given return period (abscissa) for 3-day (left) and 1-day (right) precipitation for station Grono. The return level estimates are given by the blue line, while their 95% confidence bounds are colored in green.

Locarno/Monti
Return level plots showing, with lines, the best estimate for the return levels and the corresponding 95% confidence intervals
Plots of return levels and their uncertainty (ordinate) for a given return period (abscissa) for 3-day (left) and 1-day (right) precipitation for station Locarno/Monti. The return level estimates are given by the blue line, while their 95% confidence bounds are colored in green.

Magadino/Cadenazzo
Tables listing the dates of the 10 highest annual 3-day and 1-day precipitation maxima with the corresponding precipitation sums.
10 highest annual 3-day (left) and 1-day (right) precipitation maxima at station Magadino/Cadenazzo between 1961 and 2014. Precipitation sums are calculated from 05:40 UTC of one day to 05:40 UTC of the following day. The date indicates the last entire day over which the precipitation is summed.

Mosogno
Tables listing the dates of the 10 highest annual 3-day and 1-day precipitation maxima with the corresponding precipitation sums.
10 highest annual 3-day (left) and 1-day (right) precipitation maxima at station Mosogno between 1961 and 2014. Precipitation sums are calculated from 05:40 UTC of one day to 05:40 UTC of the following day. The date indicates the last entire day over which the precipitation is summed.

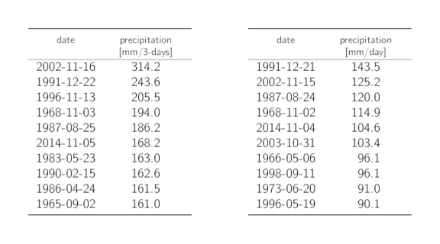
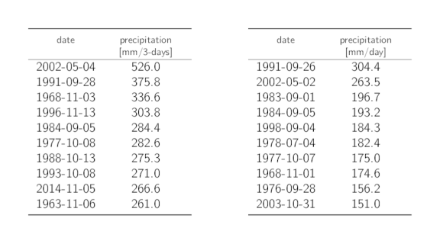
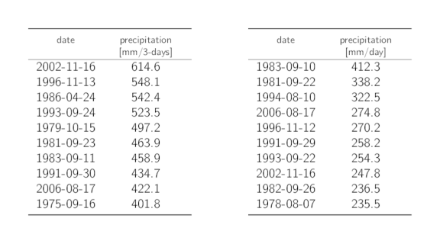
Note: The reliability of the results for 1-day precipitation is poor, hence no extreme value analysis is given.

Piotta
Tables listing the dates of the 10 highest annual 3-day and 1-day precipitation maxima with the corresponding precipitation sums.
10 highest annual 3-day (left) and 1-day (right) precipitation maxima at station Piotta between 1980 and 2014. Precipitation sums are calculated from 05:40 UTC of one day to 05:40 UTC of the following day. The date indicates the last entire day over which the precipitation is summed.

Robièi
Tables listing the dates of the 10 highest annual 3-day and 1-day precipitation maxima with the corresponding precipitation sums.
10 highest annual 3-day (left) and 1-day (right) precipitation maxima at station Robièi between 1992 and 2014. Precipitation sums are calculated from 05:40 UTC of one day to 05:40 UTC of the following day. The date indicates the last entire day over which the precipitation is summed.

S. Bernardino
Tables listing the dates of the 10 highest annual 3-day and 1-day precipitation maxima with the corresponding precipitation sums.
10 highest annual 3-day (left) and 1-day (right) precipitation maxima at station S. Bernardino between 1968 and 2014. Precipitation sums are calculated from 05:40 UTC of one day to 05:40 UTC of the following day. The date indicates the last entire day over which the precipitation is summed.

Soglio
Tables listing the dates of the 10 highest annual 3-day and 1-day precipitation maxima with the corresponding precipitation sums.
10 highest annual 3-day (left) and 1-day (right) precipitation maxima at station Soglio between 1961 and 2014. Precipitation sums are calculated from 05:40 UTC of one day to 05:40 UTC of the following day. The date indicates the last entire day over which the precipitation is summed.

Ulrichen
Tables listing the dates of the 10 highest annual 3-day and 1-day precipitation maxima with the corresponding precipitation sums.
10 highest annual 3-day (left) and 1-day (right) precipitation maxima at station Ulrichen between 1981 and 2014. Precipitation sums are calculated from 05:40 UTC of one day to 05:40 UTC of the following day. The date indicates the last entire day over which the precipitation is summed.