Service Navigation
Search
The ten stations measuring hourly precipitation that recorded the highest cumulated precipitation between 13 and 17 November 2002 are mostly located on the southern side of the Alps in the Ticino and Grisons regions. Only two stations are located in the central part of the Alps (Ulrichen and Disentis) and one in the south-west of the Valais (Col du Grand St-Bernard).
The stations located on the southern side of the Alps measured little precipitation on 13 November, but it considerably increased on 14 November. Between 14 and 16 November, the precipitation fell continuously with very high hourly intensity. The highest intensities were measured in Ticino at stations Magadino/Cadenazzo (17.2 mm/h) and Locarno/Monti (13.1 mm/h). In the Grisons, the maximum hourly intensity was measured at station Disentis/Sedrun (10.8 mm/h). The persistence of high intensity precipitation over three days made this event particularly damaging on the central Alpine north slope, in the Grisons and in Ticino.
The station in Ticino that measured the largest precipitation sum between 13 and 17 November is Magadino/Cadenazzo with 500 mm. In the central part of the Alps, station Disentis/Sedrun measured 284.2 mm in 5 days. Even though station Col du Grand St-Bernard is not located within the affected region, it also received large precipitation amounts between 13 and 17 November (238.7 mm) and appears in the ten largest sums.
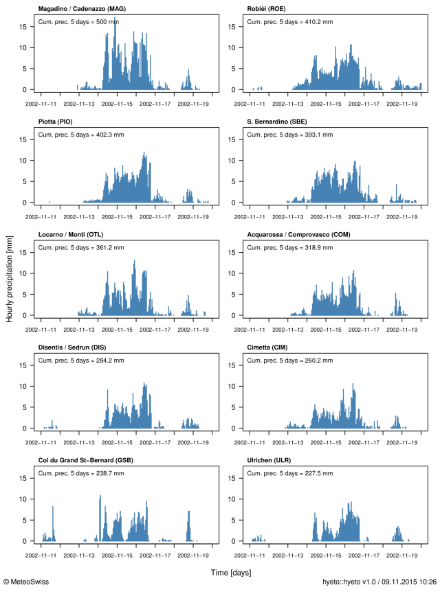
The hyetographs display hourly precipitation starting 2 days before the beginning of the event (11 November 2002) and ending 2 days after the end of the event (19 November 2002). The hourly precipitation [mm] is represented by the vertical blue bars and the date is given on the time axis, where each day begins at 00 UTC. The cumulated precipitation over the duration of the event (5 days) is indicated in the top left corner of the plots and corresponds to the precipitation measured between 13 November 2002, 05:40 UTC and 18 November 2002, 05:40 UTC.
Comparison with other heavy precipitation events
The plots in the infoboxes below show the event of 13 to 17 November 2002 compared with other events for stations Disentis/Sedrun, Magadino/Cadenazzo, Piotta and S. Bernardino. Since the precipitation amounts measured between 14 and 16 November 2002 were particularly high, the 72-hour precipitation sum was selected for the comparison.
For all four stations, the event of 13-17 November 2002 is the event with the highest 72-hour precipitation ever measured in fall between 1981 and 2014. In Ticino, 483.8 mm and 388.3 mm was measured at stations Magadino/Cadenazzo and Piotta respectively during that time interval. In the Grisons, stations S. Bernardino and Disentis/Sedrun recorded 368.7 mm and 282.5 mm of precipitation respectively within 72 hours.
While for stations Piotta, S. Bernardino and Disentis/Sedrun, the precipitation fallen during this event also corresponds to the highest 3-day precipitation measured between 1981 and 2014, all seasons considered, station Magadino/Cadenazzo had already measured a higher sum earlier that year (526 mm between 2 and 4 May 2002).
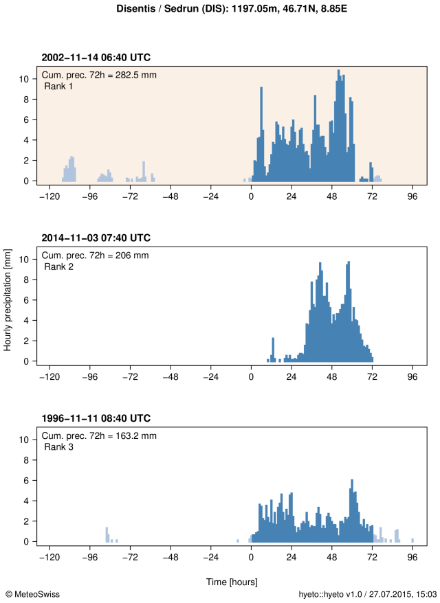
Comparison of the event (beige background) with two other large 72-hour precipitation sums (white background) that were measured at station Disentis/Sedrun (NW Grisons) in fall (SON) between 1981 and 2014. The hourly precipitation [mm] is represented by vertical bars: blue during, and grey before and after the 72-hour intervals. The dates and times corresponding to the beginning of the 72-hour intervals are given above the plots and indicated by 0 on the time axis. The rank indicates the ranking of the events compared to other 72-hour precipitation sums at that station.
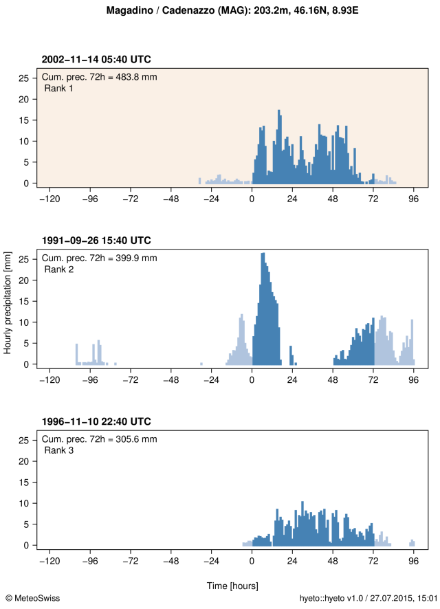
Comparison of the event (beige background) with two other large 72-hour precipitation sums (white background) that were measured at station Magadino/Cadenazzo (Ticino) in fall (SON) between 1981 and 2014. The hourly precipitation [mm] is represented by vertical bars: blue during, and grey before and after the 72-hour intervals. The dates and times corresponding to the beginning of the 72-hour intervals are given above the plots and indicated by 0 on the time axis. The rank indicates the ranking of the events compared to other 72-hour precipitation sums at that station.
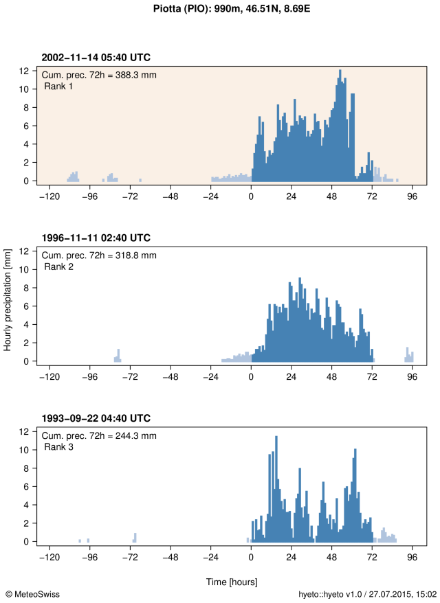
Comparison of the event (beige background) with two other large 72-hour precipitation sums (white background) that were measured at station Piotta (Ticino) in fall (SON) between 1981 and 2014. The hourly precipitation [mm] is represented by vertical bars: blue during, and grey before and after the 72-hour intervals. The dates and times corresponding to the beginning of the 72-hour intervals are given above the plots and indicated by 0 on the time axis. The rank indicates the ranking of the events compared to other 72-hour precipitation sums at that station.
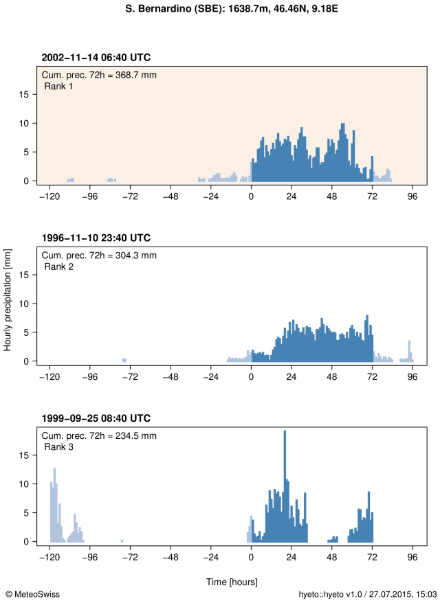
Comparison of the event (beige background) with two other large 72-hour precipitation sums (white background) that were measured at station S. Bernardino (South Grisons) in fall (SON) between 1981 and 2014. The hourly precipitation [mm] is represented by vertical bars: blue during, and grey before and after the 72-hour intervals. The dates and times corresponding to the beginning of the 72-hour intervals are given above the plots and indicated by 0 on the time axis. The rank indicates the ranking of the events compared to other 72-hour precipitation sums at that station.
Moving sums of hourly precipitation cumulated over a duration interval of 72 hours are used in order to determine the highest 72-hour precipitation sums at the given stations and to determine the ranking of the event of November 2002 compared to other precipitation sums of same duration for the same season (SON). A large 72-hour precipitation sum does not always result from one long-lasting precipitation event, but can also result from two successive precipitation events separated by a certain amount of hours. Note that the starting time of the duration interval over which the cumulated precipitation is the highest can differ from one station to another.
Automatic stations measuring hourly precipitation were used to produce the hyetographs presented above. These stations are not always located, however, where the highest precipitation falls, and the daily sums are sometimes lower than those measured at other stations in the affected area that measure daily precipitation only.
| Date | MAG | MSG | CEV | FAI |
|---|---|---|---|---|
13.11.2002 | 10.4 | 10.4 | 21 | 20.5 |
14.11.2002 | 203.7 | 157.4 | 152.5 | 143.5 |
15.11.2002 | 165.4 | 209.4 | 185 | 144.3 |
16.11.2002 | 114.7 | 247.8 | 156.5 | 80.6 |
17.11.2002 | 5.8 | 12.1 | 27 | 3.6 |
3-day sum (14-16.11.2002) | 483.8 | 614.6 | 494 | 368.4 |
5-day sum (13-17.11.2002) | 500 | 637.1 | 542 | 392.5 |
Precipitation sum [mm] over 1, 3 and 5 day(s) at stations in Ticino measuring hourly precipitation (Magadino/Cadenazzo, MAG) and daily precipitation (Mosogno (MSG), Cevio (CEV) and Faido (FAI)). The sum is always calculated from 05:40 UTC of a given day to 05:40 UTC of the following day. Source: MeteoSwiss
| Date | SBE | BEH | SOG | GRO |
|---|---|---|---|---|
13.11.2002 | 12 | 14.3 | 9.4 | 6.5 |
14.11.2002 | 135.9 | 92 | 111.2 | 100 |
15.11.2002 | 122.6 | 114.7 | 101.8 | 106.1 |
16.11.2002 | 109.2 | 100 | 95.7 | 103.3 |
17.11.2002 | 13.4 | 16.4 | 2.5 | 3.5 |
3-day sum (14-16.11.2002) | 367.7 | 306.7 | 308.7 | 309.4 |
5-day sum (13-17.11.2002) | 393.1 | 337.4 | 320.6 | 319.4 |
Precipitation sum [mm] over 1, 3 and 5 day(s) at stations in the southern Grisons measuring hourly precipitation (S. Bernardino, SBE) and daily precipitation (Berninapass (BEH), Soglio (SOG) and Grono (GRO)). The sum is always calculated from 05:40 UTC of a given day to 05:40 UTC of the following day. Source: MeteoSwiss
| Date | DIS | GOS | GOA | ANT |
|---|---|---|---|---|
13.11.2002 | 0.3 | 1 | 0.4 | 0.6 |
14.11.2002 | 79.4 | 87 | 68.5 | 79.3 |
15.11.2002 | 99.1 | 125.2 | 100.3 | 88.3 |
16.11.2002 | 102.9 | 102 | 110.5 | 101.9 |
17.11.2002 | 2.5 | 0 | 0 | 0 |
3-day sum (14-16.11.2002) | 281.4 | 314.2 | 279.3 | 269.5 |
5-day sum (13-17.11.2002) | 284.2 | 315.2 | 279.7 | 270.1 |
Precipitation sum [mm] over 1, 3 and 5 day(s) at stations located on the central Alpine north slope and in the north-western Grisons measuring hourly precipitation (Disentis/Sedrun, DIS) and daily precipitation (Göschenen (GOS), Göscheneralp (GOA) and Andermatt (ANT)). The sum is always calculated from 05:40 UTC of a given day to 05:40 UTC of the following day. Source: MeteoSwiss
For almost all of the stations measuring daily precipitation, the 3-day precipitation recorded between 14 and 16 November (see tables above) corresponds to the highest precipitation sum measured at those stations between 1981 and 2014, all seasons considered. Only at station Berninapass was a higher 3-day sum measured on 11-13 November 1996 with 315.3 mm.
