Contents area

Extreme value analyses

Extreme value analyses for stations located within the affected regions of the precipitation event of 10-15 February 1990.

Footer

Top bar Navigation

Swiss federal authorities

Service Navigation

Return periods of the largest 5-day precipitation between 10 and 15 February 1990

The precipitation amounts measured between 10 and 15 February 1990 in Switzerland are not only rare in the Jura, in the Vaud Alps and on the eastern Alpine north slope, but also further inside the Alpine chain, as well as on the Plateau. For many stations located in those regions, the largest 5-day precipitation recorded between 10 and 15 February corresponds to return levels having return periods of 10 to more than 100 years.

The rarest 5-day precipitation amounts were measured at the foot of the Alpstein (Sevelen: 212.5 mm), in the Jura mountains (Les Brenets: 163.8 mm) and in the Valais (Les Marécottes: 311.5 mm; Hémérence: 164.9 mm; Sierre: 163 mm) and correspond to return periods of more than 100 years.

5-day precipitation sums having return periods of 50 to 100 years were measured in the Jura mountains (L’Auberson: 192 mm; Baulmes: 187.3 mm; L’Abergement: 182.7 mm; Le Locle: 165.1 mm; Valeyres-sous-Rances: 139 mm), as well as in the Bernese Oberland (Gsteig, Gstaad: 285.7 mm; Boltigen: 216 mm).

Map of Switzerland with, in colored circles, the return periods of the 5-day precipitation between 10 and 15 February 1990.
Map of the return periods (in years) of the largest 5-day precipitation between 10 and 15 February 1990.

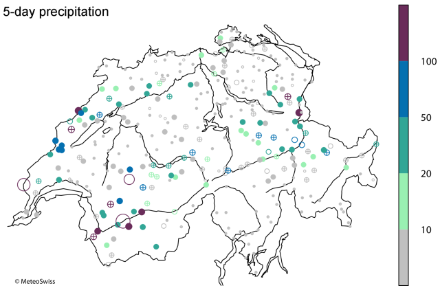
The largest 5-day precipitation is measured between 10 February 1990, 05:40 UTC and 16 February 1990, 05:40 UTC. The return periods are based on the generalized extreme value distribution estimated from the annual 5-day precipitation maxima during the period 1961-2010. The size of the circles is proportional to the value of the return period. The filling of the circles indicates the reliability of the statistics: good (filled circle), questionable (circle with cross) and poor (empty circle).

Return periods of the largest 4, 3, 2 and 1-day precipitation

For the stations located in the Jura mountains, the largest 4, 3 and 2-day precipitation amounts recorded between 10 and 15 February 1990 are also rare (return periods of 10 to 100 years), although slightly less than the 5-day precipitation sums. The largest 1-day precipitation amounts measured in that region, on the other hand, are less rare, since they correspond to return periods of “only” 10 to 20 years. La Cure is the only station in the Jura mountains that measured very rare 1-day precipitation, corresponding to a return period of more than 100 years.

A similar observation can be made for the stations located in the Rhein Valley at the foot of the Alpstein. While the 1 and 2-day precipitation are not exceptionally rare (only one station measured 2-day precipitation having a return period of 20 to 50 years), very rare 3 and 4-day precipitation amounts were recorded in that region, corresponding to return levels having return periods of 50 to more than 100 years.

For the stations located in the Vaud Alps and in the rest of the eastern Alpine north slope, it is more difficult to distinguish a pattern. The stations in those areas recorded 1 to 4-day precipitation amounts having return periods of 10 to 50 years (Vaud Alps) and 10 to more than 100 years (eastern Alpine north slope). The highest return periods are found at station Säntis: between 10 and 15 February, this station recorded, for example, a 1-day precipitation sum corresponding to a 50 to 100-year event and a 4-day precipitation sum corresponding to a 100-year event or more.

Finally, in the rest of Switzerland, 1 to 4-day precipitation amounts corresponding to return periods of 10 to more than 100 years were also measured at stations located on the Plateau and in other parts of the Alpine north slope and of the Alps.

In conclusion, with the exception of stations La Cure (Jura) and Boltigen (Bernese Oberland), which measured very rare 1-day precipitation amounts, the largest precipitation fallen within one day between 10 and 15 February was generally less rare than the accumulation of precipitation over several days. This is especially the case for stations located in the Jura mountains and at the foot of the Alpstein, for which the largest return periods are found when considering 5-day precipitation.

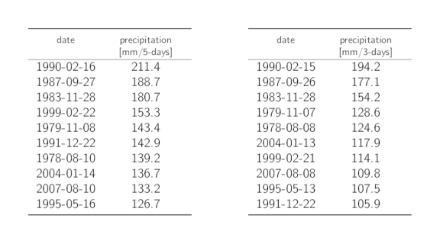
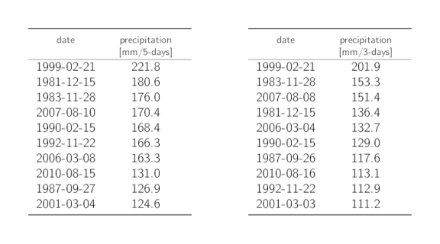
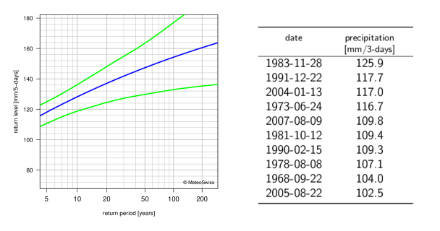
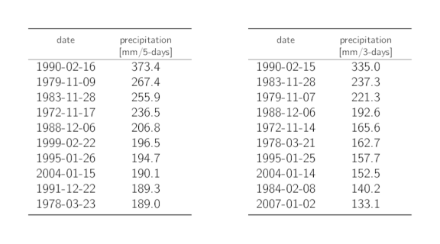
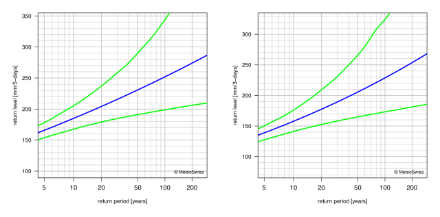
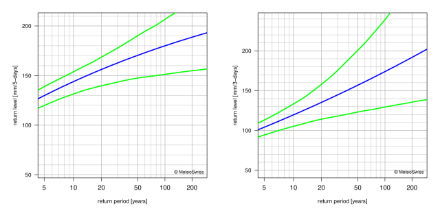
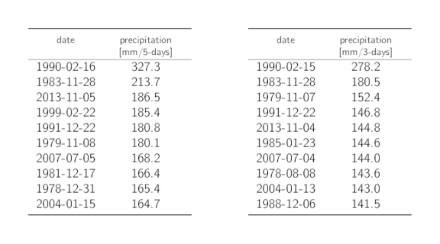
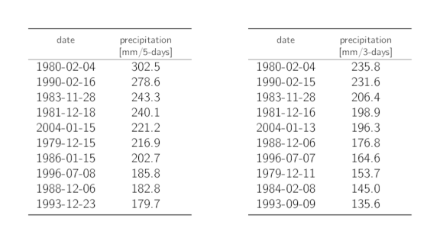
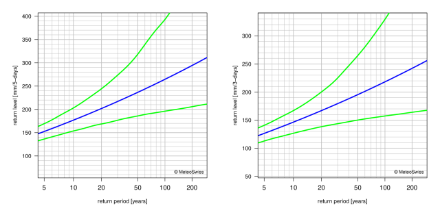
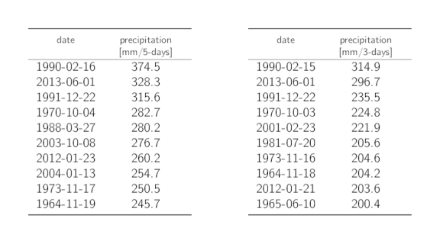
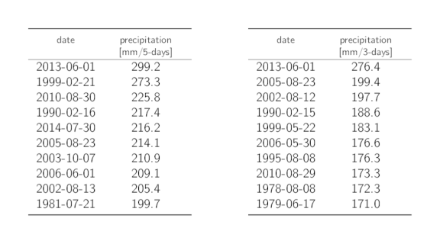
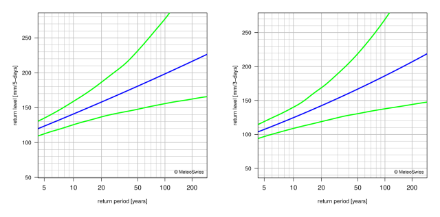
Extreme value analyses for 5-day and 3-day precipitation

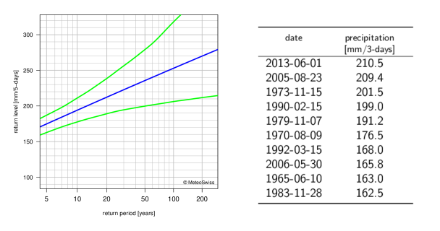
This section provides the extreme value analyses for some of the stations presented in the section Hyetographs. The statistics are based on the period 1961-2010. Return level plots of 5-day and 3-day precipitation maxima are shown when the statistics are reliable. When the statistics are not reliable or when the length of the records is too short, tables of the ten highest precipitation maxima for the period 1961-2014 or between the beginning of the measurements and 2014 are shown instead. In addition, PDFs of the extreme value analyses are given when the reliability of the results is good or questionable.

Bullet/La Frétaz
Tables listing the dates of the 10 highest annual 5-day and 3-day precipitation maxima with the corresponding precipitation sums.
10 highest annual 5-day (left) and 3-day (right) precipitation maxima at station Bullet/La Frétaz between 1978 and 2014. Precipitation sums are calculated from 05:40 UTC of one day to 05:40 UTC of the following day. The date indicates the last entire day over which the precipitation is summed.

Chasseral
Tables listing the dates of the 10 highest annual 5-day and 3-day precipitation maxima with the corresponding precipitation sums.
10 highest annual 5-day (left) and 3-day (right) precipitation maxima at station Chasseral between 1981 and 2014. Precipitation sums are calculated from 05:40 UTC of one day to 05:40 UTC of the following day. The date indicates the last entire day over which the precipitation is summed.

Château-d’Oex
Left: return level plot for 5-day precipitation showing, with lines, the best estimate for the return levels and the corresponding 95% confidence intervals. Right: table listing the dates of the 10 highest 3-day precipitation maxima with the corresponding precipitation sums.
Left: plot of return levels and their uncertainty (ordinate) for a given return period (abscissa) for 5-day precipitation for station Château-d’Oex. The return level estimates are given by the blue line, while their 95% confidence intervals are colored in green. Right: 10 highest annual 3-day precipitation maxima between 1961 and 2014. Precipitation sums are calculated from 05:40 UTC of one day to 05:40 UTC of the following day. The date indicates the last entire day over which the precipitation is summed.

Col des Mosses
Tables listing the dates of the 10 highest annual 5-day and 3-day precipitation maxima with the corresponding precipitation sums.
10 highest annual 5-day (left) and 3-day (right) precipitation maxima at station Col des Mosses between 1972 and 2014. Precipitation sums are calculated from 05:40 UTC of one day to 05:40 UTC of the following day. The date indicates the last entire day over which the precipitation is summed.

Ebnat-Kappel
Return level plots showing, with lines, the best estimate for the return levels and the corresponding 95% confidence intervals.
Plots of return levels and their uncertainty (ordinate) for a given return period (abscissa) for 5-day (left) and 3-day (right) precipitation for station Ebnat-Kappel. The return level estimates are given by the blue line, while their 95% confidence intervals are colored in green.

La Chaux-de-Fonds
Return level plots showing, with lines, the best estimate for the return levels and the corresponding 95% confidence intervals.
Plots of return levels and their uncertainty (ordinate) for a given return period (abscissa) for 5-day (left) and 3-day (right) precipitation for station La Chaux-de-Fonds. The return level estimates are given by the blue line, while their 95% confidence intervals are colored in green.

La Cure
Tables listing the dates of the 10 highest annual 5-day and 3-day precipitation maxima with the corresponding precipitation sums.
10 highest annual 5-day (left) and 3-day (right) precipitation maxima at station La Cure between 1961 and 2014. Precipitation sums are calculated from 05:40 UTC of one day to 05:40 UTC of the following day. The date indicates the last entire day over which the precipitation is summed.

La Dôle
Tables listing the dates of the 10 highest annual 5-day and 3-day precipitation maxima with the corresponding precipitation sums.
10 highest annual 5-day (left) and 3-day (right) precipitation maxima at station La Dôle between 1973 and 2014. Precipitation sums are calculated from 05:40 UTC of one day to 05:40 UTC of the following day. The date indicates the last entire day over which the precipitation is summed.

Magglingen
Return level plots showing, with lines, the best estimate for the return levels and the corresponding 95% confidence intervals.
Plots of return levels and their uncertainty (ordinate) for a given return period (abscissa) for 5-day (left) and 3-day (right) precipitation for station Magglingen. The return level estimates are given by the blue line, while their 95% confidence intervals are colored in green.

Säntis
Tables listing the dates of the 10 highest annual 5-day and 3-day precipitation maxima with the corresponding precipitation sums.
10 highest annual 5-day (left) and 3-day (right) precipitation maxima at station Säntis between 1961 and 2014. Precipitation sums are calculated from 05:40 UTC of one day to 05:40 UTC of the following day. The date indicates the last entire day over which the precipitation is summed.

Schwägalp
Tables listing the dates of the 10 highest annual 5-day and 3-day precipitation maxima with the corresponding precipitation sums.
10 highest annual 5-day (left) and 3-day (right) precipitation maxima at station Schwägalp between 1972 and 2014. Precipitation sums are calculated from 05:40 UTC of one day to 05:40 UTC of the following day. The date indicates the last entire day over which the precipitation is summed.

Sevelen
Return level plots showing, with lines, the best estimate for the return levels and the corresponding 95% confidence intervals.
Plots of return levels and their uncertainty (ordinate) for a given return period (abscissa) for 5-day (left) and 3-day (right) precipitation for station Sevelen. The return level estimates are given by the blue line, while their 95% confidence intervals are colored in green.

Starkenbach
Left: return level plot for 5-day precipitation showing, with lines, the best estimate for the return levels and the corresponding 95% confidence intervals. Right: table listing the dates of the 10 highest 3-day precipitation maxima with the corresponding precipitation sums.
Left: plot of return levels and their uncertainty (ordinate) for a given return period (abscissa) for 5-day precipitation for station Starkenbach. The return level estimates are given by the blue line, while their 95% confidence intervals are colored in green. Right: 10 highest annual 3-day precipitation maxima between 1961 and 2014. Precipitation sums are calculated from 05:40 UTC of one day to 05:40 UTC of the following day. The date indicates the last entire day over which the precipitation is summed.