Service Navigation
Search
Short-range forecast vs weekly trend
It is important to distinguish between a daily weather forecast (short range) and a weekly outlook. The former is about predicting how the weather will develop from one day to the next. With current forecast models, it is possible to predict daily developments in the weather up to seven days in advance (with differing degrees of reliability, depending on the weather situation). Beyond that period, the reliability decreases rapidly – and after 10 days, almost all predictability is lost (i.e. a random forecast would be just as reliable). Accordingly, it makes no sense to look at forecasts for an event in a month’s time.
Monthly forecasts are about indicating weekly trends, i.e. whether the coming weeks will be hotter or colder and wetter or drier than the seasonal average. In other words, they are not about predicting the weather on a specific date. For example, if a week is expected to be warmer and drier than normal, this does not rule out the passage of a cold front with precipitation and a temporary drop in temperatures. On that basis, it is possible to reach a sensible interpretation of weekly forecasts.
Monthly forecasts – what to bear in mind
A forecast of the weekly averages for the coming weeks should be seen as a general trend, around which the weather can vary from one day to the next. In the event of a sudden change in the weather, it is quite possible for the first half of the week to be very cold and wet, but the second half to be much milder and drier. In that case, the weekly average would be close to the seasonal average in terms of temperature and precipitation.
Examples of use or interpretation
- Predicting a prolonged drought.
- Estimating if there is likely to be a significant change in weather patterns compared to the current situation.
- Predicting the energy demand for heating.
Examples of incorrect use or interpretation
- Concluding that a dry anomaly means it won’t rain for the whole week.
- Concluding that a dry and warm anomaly means it will be sunny. This forecast provides no information on cloud cover. Particularly in winter, it can be very cloudy (low stratus) in the Swiss plateau and yet remain dry.
- Confusing probability and quantity: even if there is a very high probability that a week will be wetter than normal, that does not necessarily mean the amount of rainfall will be very high.
- Making a forecast for a specific day, e.g. for an event.
Examples of monthly forecasts
MeteoSwiss provides monthly forecasts in the form of probabilities compared to the seasonal average (calculated for the period 1991–2020). The monthly outlook is a forecast of the temperature and precipitation trend for the next three weeks. These are based on the forecasts of the European Centre for Medium-Range Weather Forecasts.
Below are two examples of weekly forecasts for western Switzerland. The same graphs are also available for the north-east and south of the country.
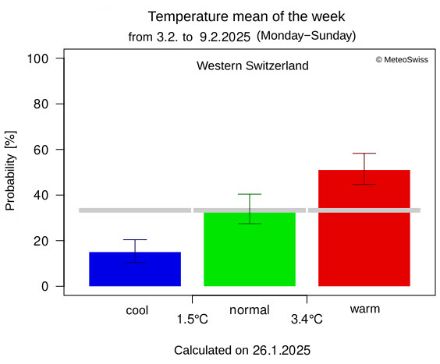
Forecast for the week of 3 to 9 February 2025
In this example, the week of 3 to 9 February 2025 is forecast to be milder than average with a probability of 50% or to feature average temperatures with a probability of 30%. The probability of temperatures below the seasonal average is significantly lower (>20%).
The trend is clearer in terms of precipitation: it should be drier than average with a probability of over 70%. That does not rule out precipitation, but the forecast gives a probability of over 70% that there will be less than 3.6 mm of rain over the whole week.
This trend concurs with the pressure forecast from ECMWF, which clearly shows an anticyclonic tendency in Europe (positive pressure anomaly, high pressure). In winter, this often means grey weather in the lowlands and mild, sunny weather in the mountains.


Forecast for the week of 28 July to 3 August 2025 (H3)
In the second example, we consider a week in high summer, between July and August. The probability of that week being warmer than the seasonal average is low (<20%). There are equal probabilities that the temperature will be close to average or below average (around 40%). There is therefore a high probability that the week will not end up being too hot. It is not possible, however, to say whether the week will be on the colder side or temperatures will correspond to the seasonal average.
The signal is even less clear when it comes to precipitation. The probabilities of total precipitation that is above, below and in line with the seasonal average are almost equal. It is therefore impossible to predict a trend for this week.
The pressure anomaly forecast from ECMWF for the same week shows a trend towards above-average pressure over the Atlantic and lower pressure over Scandinavia and Eastern Europe, pointing to a northwesterly air flow over Switzerland. That explains the low probability of temperatures warmer than the seasonal average. Precipitation in summer is particularly dependent on the instability of the air and the location of small-scale disturbances (short waves, cold air at higher altitudes, cut-off lows). These factors are difficult to predict a week in advance, which in turn affects the precipitation trend.


Monthly outlook and droughts
These monthly trends are used in particular for drought forecasts. Based on these trends, it is possible to calculate a drought indicator (CDI) for the next four weeks at the regional level. This helps to predict prolonged situations of drought and to issue warnings if necessary. All information on droughts can be found on the national drought platform.