Service Navigation
Search
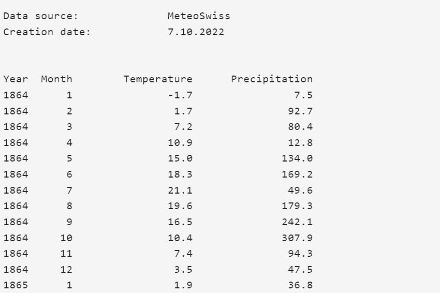
Explanations relating to the series of numbers
Homogenisation indicates the adjustment of historic measured values to current measuring conditions. Each series of data has a reference date (termed “reference date“ in the data), specifying the date up to which the series has been homogenised. If the processing is deemed tentative because the data basis for the correction of the last inhomogeneity was low, the corresponding hint in the data header (“last inhomogeneity provisionally corrected”) is set to ”yes”; otherwise it is set to ”no”. The latest measured values are added to the series every month, starting from the reference date. These data can contain inhomogeneities. In the event of major inhomogeneities, the continuation of the series is temporarily suspended.
Homogeneous data from other stations
Homogeneous series of measurements from other measuring stations of the weather service MeteoSwiss and series of measurements of additional parameters can be obtained from the customer service.