Wind roses show the long-time monthly and annual averages of the wind direction and speed at ground-based measuring stations in Switzerland. Average values from the period between 1981 and 2000 are illustrated graphically. Hourly averages of the wind direction and speed within the currently valid normal period were evaluated.
Wind roses per station
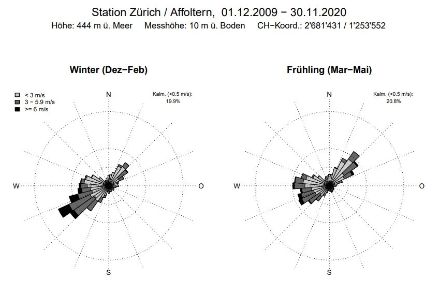
Due to the renewal of the ground measurement network in the years 2005 to 2010 and the associated relocation of the wind measurements in numerous cases, only the measured values from 2010 onwards were used for the wind roses of the normal period 1991-2020.
Wind direction and speed in Engelberg

Wind roses indicate the frequency distribution of the wind direction and speed. In so doing, the direction from which the wind is blowing is indicated. Without considering the speed, it becomes apparent that the wind in Engelberg is often blowing from the east and west. In contrast, almost no winds blowing from a northerly or southerly direction are registered. Weak winds (less than 3 m/s), plotted in light grey in the graphic chart, are most common, particularly from easterly directions. For example, more than 15 percent of all measured values originate exactly from the east (as shown in the circular scale). Average winds (between 3 and 5.9 m/s), marked grey, are usually measured from a south-westerly direction. Strong winds (in excess of 5.9 m/s), marked black in the graphic chart, are rare and originate exclusively from the east. The frequency of windless periods is also indicated: so-called calms (wind speeds of less than 0.5 m/s) were registered in Engelberg in nearly 15% of measurements.
Other data and maps
Normal values can also be retrieved in the following format and for the following measured parameters: