The weather service MeteoSchweiz provides climate normals in table format from all measuring stations with long and homogeneous time series of measurements. Monthly and annual normals are available for a number of measured parameters and different reference periods.
Normal values per measured parameter
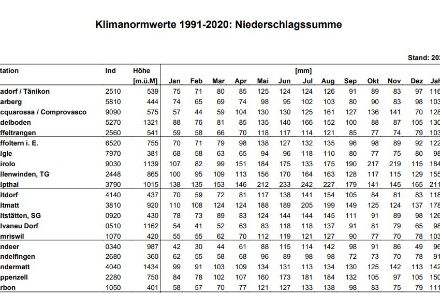
For each table, the climate normals of one measured parameter from all available stations have been compiled in pdf or text format. This table form is only available for parameters with homogeneous data series.
The text files are separated by tabs and intended for electronic data processing. The periodic processing of newly emerging inhomogeneities in the data series can result in altered normal values for some stations at the beginning of a new year. The processing status can be gathered from the individual documents.
Parameter
File type for download
File language
Normal period | |||
---|---|---|---|
1961 - 1990 | 1981 - 2010 | 1991 - 2020 | |
Temperature average Average of all temperature measurements of one month | PDF document(PDF, 80kB, English) | PDF document(PDF, 70kB, English) | |
Temperature maximum Average of all daily maximum temperatures of one month | PDF document(PDF, 70kB, English) | PDF document(PDF, 70kB, English) | |
Temperature minimum Average of all daily minimum temperatures of one month | PDF document(PDF, 80kB, English) | PDF document(PDF, 70kB, English) | |
Icy days Number of days per month on which the temperature remains below 0° C | PDF document(PDF, 70kB, English) | PDF document(PDF, 70kB, English) | |
Frost days Number of days per month on which the temperature dips below 0° C | PDF document(PDF, 70kB, English) | PDF document(PDF, 70kB, English) | |
Summer days Number of days per month on which the temperature reaches or exceeds 25° C | PDF document(PDF, 70kB, English) | PDF document(PDF, 70kB, English) | |
Dog days Number of days per month on which the temperature reaches or exceeds 30° C | PDF document(PDF, 70kB, English) | PDF document(PDF, 70kB, English) |
Normal period | |||
---|---|---|---|
1961 - 1990 | 1981 - 2010 | 1991 - 2020 | |
Temperature average Average of all temperature measurements of one month | TXT document(TXT, 10kB, English) | TXT document(TXT, 10kB, English) | |
Temperature maximum Average of all daily maximum temperatures of one month | TXT document(TXT, 10kB, English) | TXT document(TXT, 10kB, English) | |
Temperature minimum Average of all daily minimum temperatures of one month | TXT document(TXT, 10kB, English) | TXT document(TXT, 10kB, English) | |
Icy days Number of days per month on which the temperature remains below 0° C | TXT document(TXT, 10kB, English) | TXT document(TXT, 10kB, English) | |
Frost days Number of days per month on which the temperature dips below 0° C | TXT document(TXT, 10kB, English) | TXT document(TXT, 10kB, English) | |
Summer days Number of days per month on which the temperature reaches or exceeds 25° C | TXT document(TXT, 10kB, English) | TXT document(TXT, 10kB, English) | |
Dog days Number of days per month on which the temperature reaches or exceeds 30° C | TXT document(TXT, 10kB, English) | TXT document(TXT, 10kB, English) |
Normal period | |||
---|---|---|---|
1961 - 1990 | 1981 - 2010 | 1991 - 2020 | |
Precipitation totals Total solid and liquid precipitation of one month | PDF document(PDF, 320kB, English) | PDF document(PDF, 320kB, English) | |
Days with precipitation Number of days per month on which 1 mm or more of precipitation is measured | PDF document(PDF, 320kB, English) | PDF document(PDF, 320kB, English) |
Normal period | |||
---|---|---|---|
1961 - 1990 | 1981 - 2010 | 1991 - 2020 | |
Precipitation totals Total solid and liquid precipitation of one month | TXT document(TXT, 50kB, English) | TXT document(TXT, 50kB, English) | |
Days with precipitation Number of days per month on which 1 mm or more of precipitation is measured | TXT document(TXT, 50kB, English) | TXT document(TXT, 50kB, English) |
Normal period | |||
---|---|---|---|
1961 - 1990 | 1981 - 2010 | 1991 - 2020 | |
Duration in hours Total hours of sunshine measured at a location over a one-month period | PDF document(PDF, 70kB, English) | PDF document(PDF, 70kB, English) | |
Duration in percent Ratio of sunshine measured over a one-month period relative to the maximum possible duration of sunshine at a location | PDF document(PDF, 70kB, English) | PDF document(PDF, 70kB, English) | |
Global radiation from 1981 - 2000 Average monthly solar radiation of the years 1981-2000 emitted onto a horizontal area on the surface of the Earth | PDF document(PDF, 70kB, English) |
Normal period | |||
---|---|---|---|
1961 - 1990 | 1981 - 2010 | 1991 - 2020 | |
Duration in hours Total hours of sunshine measured at a location over a one-month period | TXT document(TXT, 10kB, English) | TXT document(TXT, 10kB, English) | |
Duration in percent Ratio of sunshine measured over a one-month period relative to the maximum possible duration of sunshine at a location | TXT document(TXT, 10kB, English) | TXT document(TXT, 10kB, English) | |
Global radiation from 1981 - 2000 Average monthly solar radiation of the years 1981-2000 emitted onto a horizontal area on the surface of the Earth | TXT document(TXT, 10kB, English) |
Normal period | |||
---|---|---|---|
1961 - 1990 | 1981 - 2010 | 1991 - 2020 | |
Wind speed Average monthly wind speed at a location | PDF document(PDF, 70kB, English) | PDF document(PDF, 70kB, English) |
Normal period | |||
---|---|---|---|
1961 - 1990 | 1981 - 2010 | 1991 - 2020 | |
Wind speed Average monthly wind speed at a location | TXT document(TXT, 10kB, English) | TXT document(TXT, 10kB, English) |
Normal period | |||
---|---|---|---|
1961 - 1990 | 1981 - 2010 | 1991 - 2020 | |
Air pressure Average of all atmospheric pressure measurements of a month at the altitude of the station | PDF document(PDF, 70kB, English) | PDF document(PDF, 70kB, English) |
Normal period | |||
---|---|---|---|
1961 - 1990 | 1981 - 2010 | 1991 - 2020 | |
Air pressure Average of all atmospheric pressure measurements of a month at the altitude of the station | TXT document(TXT, 10kB, English) | TXT document(TXT, 10kB, English) |
Normal period | |||
---|---|---|---|
1961 - 1990 | 1981 - 2010 | 1991 - 2020 | |
Cloud cover Ratio of sky covered with clouds in percent per month | PDF document(PDF, 40kB, English) |
Normal period | |||
---|---|---|---|
1961 - 1990 | 1981 - 2010 | 1991 - 2020 | |
Cloud cover Ratio of sky covered with clouds in percent per month | TXT document(TXT, 10kB, English) |
Normal period | |||
---|---|---|---|
1961 - 1990 | 1981 - 2010 | 1991 - 2020 | |
Vapour pressure Monthly average of the partial pressure of water vapour in the atmosphere at a location | PDF document(PDF, 70kB, English) | PDF document(PDF, 70kB, English) |
Normal period | |||
---|---|---|---|
1961 - 1990 | 1981 - 2010 | 1991 - 2020 | |
Vapour pressure Monthly average of the partial pressure of water vapour in the atmosphere at a location | TXT document(TXT, 10kB, English) | TXT document(TXT, 10kB, English) |
Other data and maps pertaining to normal values
Normal values can also be retrieved in the following formats and for the following measured parameters:
Further information
Links
Climate diagrams and climate normals worldwide
Climate diagrams and climate normals from measuring stations around the globe.
WMO Climate Normals
WMO climate normals worldwide.