Service Navigation
Search
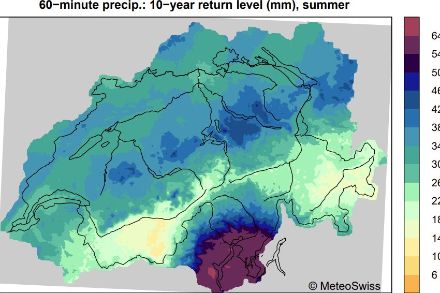
The graphics represent return levels as a function of return period T. A return level quantifies the amount of precipitation that, in today’s climate and at the location of interest, is exceeded with a probability of 1/T in one year. Additional graphics represent the uncertainty of the estimated return levels. At present, this site depicts results for precipitation sums over the duration of one day.