Service Navigation
Search
Daily precipitation and daily mean temperature
During this event, most of the precipitation was caused by the development of a low pressure area over northern Italy, which then moved in direction of Eastern Europe (see Weather situation). While at first the precipitation was spread over a large portion of the country, the area of heaviest precipitation then shifted towards the eastern part of Switzerland, as the low pressure system progressed north-eastwards.
On 9 August, before the development of the low pressure area over northern Italy, Switzerland already received precipitation due to the inflow of moist air from the west. On the Alpine north slope, amounts between 5 and 39 mm were recorded, mostly in liquid form, as the snowline was located at an altitude of 2700-2900m on that day.
On 10 August, the precipitation in Switzerland intensified due to the confrontation of different air masses above the country. On the northern side of the Alps, up to 68 mm of precipitation was measured (maximum at station Schwägalp on the eastern Alpine north slope), while up to 112 mm was measured on the southern side of the Alps (maximum at station Ponte Tresa in Ticino). That day, there was also a slight west-east temperature gradient; with the inflow of colder maritime air from the north over the western part of Switzerland, the snowline descended to an altitude of 2200-2500m, while it was slightly higher in the central and eastern parts of Switzerland (2500-2700m) more under the influence of Mediterranean air coming from the south.
With the strengthening of the low pressure area over northern Italy the following days, warm and moist air from the Mediterranean was transported over Eastern Europe, flowing towards Switzerland from the north-east. This warm air not only caused temperatures to increase again (snowline at 2500-2900m on 12 and 13 August), but, as the moist air was lifted above the topography, intense precipitation also fell over the central and eastern parts of Switzerland, especially on 11 August. While 12-82 mm of precipitation was measured on the western Alpine north slope that day, 17-94 mm and 40-140 mm were recorded respectively on the central and eastern Alpine north slope.
Ten largest daily precipitation amounts (in mm) measured on the Alpine north slope on 11 August 2002. The precipitation is measured from 05:40 UTC to 05:40 UTC of the following day. Source: MeteoSwiss
| Station | Daily prec. 11.08.2002 |
|---|---|
Säntis | 140.1 |
Schwägalp | 117.1 |
Malbun | 109.5 |
Klöntal | 109.4 |
Wildhaus | 105.2 |
Teufen (AR) | 104 |
Trogen | 102.5 |
Innerthal | 97.5 |
Wald (AR) | 96.6 |
Bisistal | 94 |
On 12 and 13 August, the precipitation in Switzerland decreased considerably and was mostly concentrated over the eastern part of the country (maximum 34 mm at station Weissfluhjoch on 12 August).
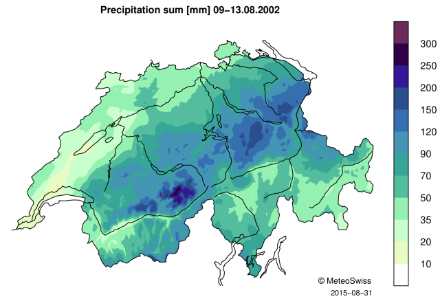
5-day precipitation sum for 9-13 August 2002
Between 9 and 13 August, the Alpine north slope received 90 to 205 mm of precipitation. The largest 5-day sums were measured at stations located on the eastern part of the Alpine north slope, but high precipitation was also recorded further to the west, for example at stations Hoch-Ybrig, Bisistal and Euthal on the central Alpine north slope (see table below). For all these stations, the precipitation amounts observed during these five days represent one half to more than three quarters of the average monthly August precipitation (norm 1981-2010).
Twelve largest 5-day precipitation sums measured on the eastern and central Alpine north slope between 9 and 13 August 2002 and average August precipitation (norm 1981-2010), both given in millimeters. Source: MeteoSwiss
| Station | 5-day sum | Norm 1981-2010 |
|---|---|---|
Schwägalp | 205.4 | 271.5 |
Säntis | 199.7 | 276.1 |
Klöntal | 176.2 | 250.3 |
Teufen | 164.6 | 185.4 |
Innterthal | 162.9 | 255 |
Trogen | 162.5 | 191.9 |
Malbun | 159.6 | 216.2 |
Hoch-Ybrig | 159.4 | 282.1 |
Tanne-Wald | 157.1 | 173 |
Wildhaus | 153.5 | 204.9 |
Bisistal | 152.5 | 256.5 |
Euthal | 148.8 | 224.2 |
Downloads
RhiresD is the spatial analysis of daily precipitation in Switzerland. The daily precipitation on day D corresponds to the rainfall and snowfall water equivalent accumulated from 06:00 UTC of day D to 06:00 UTC of day D+1. For more information about this data set, see the documentation given below.
TabsD is the spatial analysis of the daily mean air temperature 2m above ground level and is representative of the average from midnight to midnight UTC. For more information about this data set, see the documentation given below.