Contents area

Extreme value analyses

Extreme value analyses for stations located within the affected regions of the precipitation event of 9-13 August 2002.

Footer

Top bar Navigation

Swiss federal authorities

Service Navigation

Return periods of the largest 1, 2, 3, 4 and 5-day precipitation between 9 and 13 August 2002

The plots below show the return periods of the largest 1, 2, 3, 4 and 5-day precipitation sums between 9 and 13 August 2002. Except for station Kleine Scheidegg (western Alpine north slope) that measured a 3-day precipitation amount having a return period of 10 to 20 years (136.7 mm), the precipitation during this event was rare only at stations located in the eastern part of Switzerland, for which precipitation amounts corresponding to return periods of 10 to 50 years were measured.

The event was the most rare at station Teufen (eastern Alpine north slope), for which the largest 1, 2 and 3-day precipitation corresponds to a 10 to 50-year event (for respectively 104 mm/1day, 151.9 mm/2days and 161.4 mm/3days). At station Säntis (eastern Alpine north slope), the largest 1-day precipitation was also quite rare, corresponding to a 20 to 50-year event (140.1 mm).

Interestingly, the return periods of the 5-day precipitation and of the largest 4-day precipitation are lower than those of the largest 1, 2 and 3-day precipitation. This can be explained by the shift in time of the zone of maximum precipitation during the event, resulting in most stations measuring relatively large precipitation amounts during only one, two or three days instead of during the whole duration of the event.

Maps of the return periods (in years) of the largest 1, 2, 3, 4 and 5-day precipitation measured between 9 August 2002, 05:40 UTC and 14 August 2002, 05:40 UTC. The return periods are based on the generalized extreme value distribution estimated from the annual 1, 2, 3, 4 and 5-day precipitation maxima during the period 1961-2010. The size of the circles is proportional to the value of the return period. The filling of the circles indicates the reliability of the statistics: good (filled circle), questionable (circle with cross) and poor (empty circle).

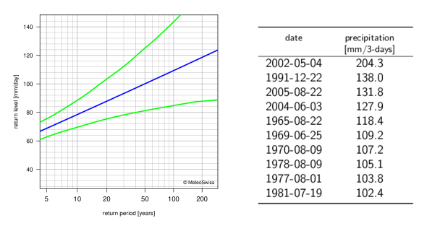
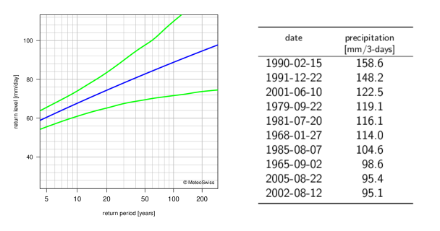
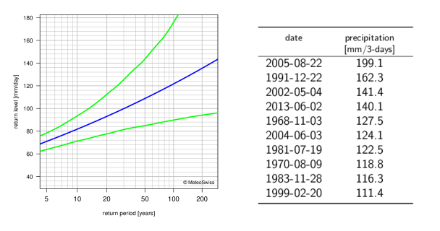
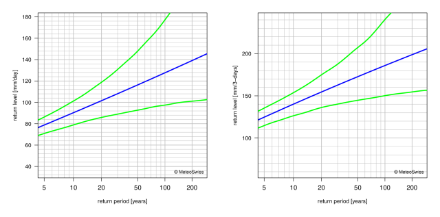
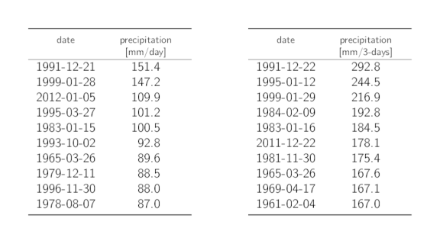
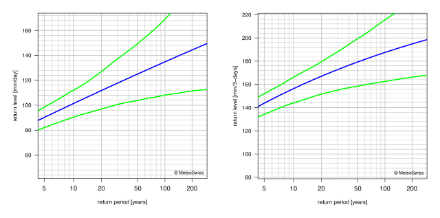
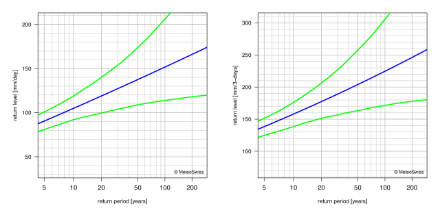
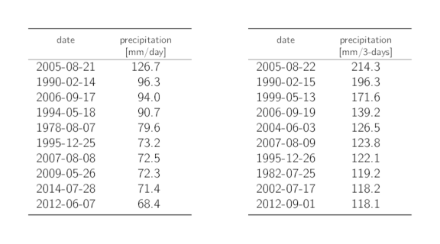
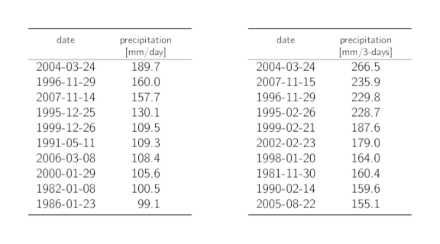
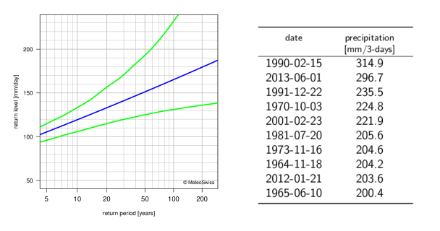
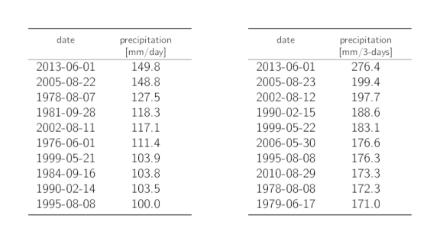
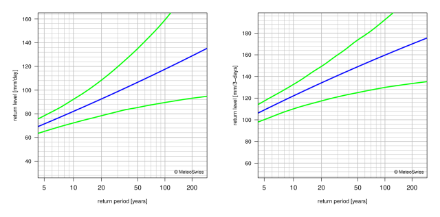
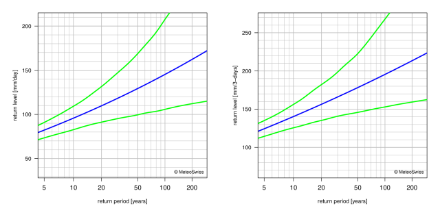
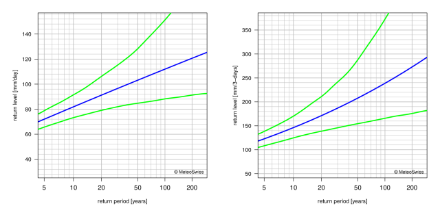
Extreme value analyses for 1-day and 3-day precipitation

This section provides the extreme value analyses for some of the stations presented in the section Hyetographs. The statistics are based on the period 1961-2010. Return level plots of 1-day and 3-day precipitation maxima are shown when the statistics are reliable. When the statistics are not reliable or when the length of the records is too short, tables of the ten highest precipitation maxima for the period 1961-2014 or between the beginning of the measurements and 2014 are shown instead. In addition, PDFs of the extreme value analyses are given when the reliability of the results is good or questionable.

Altdorf
Left: return level plot for 1-day precipitation showing, with lines, the best estimate for the return levels and the corresponding 95% confidence intervals. Right: table listing the dates of the 10 highest annual 3-day precipitation maxima with the corresponding precipitation sums.
Left: plot of return levels and their uncertainty (ordinate) for a given return period (abscissa) for 1-day precipitation for station Altdorf. The return level estimates are given by the blue line, while their 95% confidence intervals are colored in green. Right: 10 highest 3-day (right) precipitation maxima between 1961 and 2014. Precipitation sums are calculated from 05:40 UTC of one day to 05:40 UTC of the following day. The date indicates the last entire day over which the precipitation is summed.

Davos
Left: return level plot for 1-day precipitation showing, with lines, the best estimate for the return levels and the corresponding 95% confidence intervals. Right: table listing the dates of the 10 highest annual 3-day precipitation maxima with the corresponding precipitation sums.
Left: plot of return levels and their uncertainty (ordinate) for a given return period (abscissa) for 1-day precipitation for station Davos. The return level estimates are given by the blue line, while their 95% confidence intervals are colored in green. Right: 10 highest 3-day (right) precipitation maxima between 1961 and 2014. Precipitation sums are calculated from 05:40 UTC of one day to 05:40 UTC of the following day. The date indicates the last entire day over which the precipitation is summed.

Engelberg
Left: return level plot for 1-day precipitation showing, with lines, the best estimate for the return levels and the corresponding 95% confidence intervals. Right: table listing the dates of the 10 highest annual 3-day precipitation maxima with the corresponding precipitation sums.
Left: plot of return levels and their uncertainty (ordinate) for a given return period (abscissa) for 1-day precipitation for station Engelberg. The return level estimates are given by the blue line, while their 95% confidence intervals are colored in green. Right: 10 highest 3-day (right) precipitation maxima between 1961 and 2014. Precipitation sums are calculated from 05:40 UTC of one day to 05:40 UTC of the following day. The date indicates the last entire day over which the precipitation is summed.

Glarus
Return level plots showing, with lines, the best estimate for the return levels and the corresponding 95% confidence intervals.
Plots of return levels and their uncertainty (ordinate) for a given return period (abscissa) for 1-day (left) and 3-day (right) precipitation for station Glarus. The return level estimates are given by the blue line, while their 95% confidence intervals are colored in green.

Grimsel Hospiz
Tables listing the dates of the 10 highest annual 1-day and 3-day precipitation maxima with the corresponding precipitation sums.
10 highest annual 1-day (left) and 3-day (right) precipitation maxima at station Grimsel Hospiz between 1961 and 2014. Precipitation sums are calculated from 05:40 UTC of one day to 05:40 UTC of the following day. The date indicates the last entire day over which the precipitation is summed.

Innerthal
Return level plots showing, with lines, the best estimate for the return levels and the corresponding 95% confidence intervals.
Plots of return levels and their uncertainty (ordinate) for a given return period (abscissa) for 1-day (left) and 3-day (right) precipitation for station Innerthal. The return level estimates are given by the blue line, while their 95% confidence intervals are colored in green.

Klöntal
Return level plots showing, with lines, the best estimate for the return levels and the corresponding 95% confidence intervals.
Plots of return levels and their uncertainty (ordinate) for a given return period (abscissa) for 1-day (left) and 3-day (right) precipitation for station Klöntal. The return level estimates are given by the blue line, while their 95% confidence intervals are colored in green.

Napf
Tables listing the dates of the 10 highest annual 1-day and 3-day precipitation maxima with the corresponding precipitation sums.
10 highest annual 1-day (left) and 3-day (right) precipitation maxima at station Napf between 1978 and 2014. Precipitation sums are calculated from 05:40 UTC of one day to 05:40 UTC of the following day. The date indicates the last entire day over which the precipitation is summed.

Pilatus
Tables listing the dates of the 10 highest annual 1-day and 3-day precipitation maxima with the corresponding precipitation sums.
10 highest annual 1-day (left) and 3-day (right) precipitation maxima at station Pilatus between 1981 and 2014. Precipitation sums are calculated from 05:40 UTC of one day to 05:40 UTC of the following day. The date indicates the last entire day over which the precipitation is summed.

Säntis
Left: return level plot for 1-day precipitation showing, with lines, the best estimate for the return levels and the corresponding 95% confidence intervals. Right: table listing the dates of the 10 highest annual 3-day precipitation maxima with the corresponding precipitation sums.
Left: plot of return levels and their uncertainty (ordinate) for a given return period (abscissa) for 1-day precipitation for station Säntis. The return level estimates are given by the blue line, while their 95% confidence intervals are colored in green. Right: 10 highest 3-day (right) precipitation maxima between 1961 and 2014. Precipitation sums are calculated from 05:40 UTC of one day to 05:40 UTC of the following day. The date indicates the last entire day over which the precipitation is summed.

Schwägalp
Tables listing the dates of the 10 highest annual 1-day and 3-day precipitation maxima with the corresponding precipitation sums.
10 highest annual 1-day (left) and 3-day (right) precipitation maxima at station Schwägalp between 1972 and 2014. Precipitation sums are calculated from 05:40 UTC of one day to 05:40 UTC of the following day. The date indicates the last entire day over which the precipitation is summed.

St. Gallen
Return level plots showing, with lines, the best estimate for the return levels and the corresponding 95% confidence intervals.
Plots of return levels and their uncertainty (ordinate) for a given return period (abscissa) for 1-day (left) and 3-day (right) precipitation for station St. Gallen. The return level estimates are given by the blue line, while their 95% confidence intervals are colored in green.

Teufen
Return level plots showing, with lines, the best estimate for the return levels and the corresponding 95% confidence intervals.
Plots of return levels and their uncertainty (ordinate) for a given return period (abscissa) for 1-day (left) and 3-day (right) precipitation for station Teufen. The return level estimates are given by the blue line, while their 95% confidence intervals are colored in green.

Weissfluhjoch
Return level plots showing, with lines, the best estimate for the return levels and the corresponding 95% confidence intervals.
Plots of return levels and their uncertainty (ordinate) for a given return period (abscissa) for 1-day (left) and 3-day (right) precipitation for station Weissfluhjoch. The return level estimates are given by the blue line, while their 95% confidence intervals are colored in green.