Service Navigation
Search
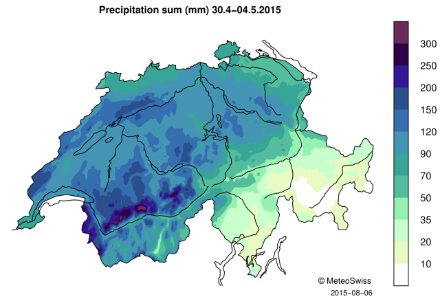
5-day precipitation sum for 30 April – 4 May 2015
During this precipitation event, all the northern side of the Alps received large amounts of precipitation. The regions which received the highest precipitation are the mountainous regions of the Valais, the Vaud Alps and the Bernese Oberland (see table below). Large 5-day precipitation sums were also measured in the Jura, at the foot of the Jura, in the Fribourg Prealps and in the Lavaux.
5-day precipitation (in mm) for 30 April to 4 May 2015 for stations located in the Valais, in the Vaud Alps, in the Bernese Oberland, in the Jura, at the foot of the Jura, in the Fribourg Prealps and in the Lavaux. Source: MeteoSwiss
| Station | Region | 5-day precipitation |
|---|---|---|
Morgins | Valais | 240.2 |
Emosson | Valais | 222 |
Derborence | Valais | 219.8 |
Col des Mosses | Vaud Alps | 205.4 |
La Dôle | Jura | 195.8 |
Riedholz-Wallierhof | Jura foot | 192.5 |
Fruence | Fribourg Prealps | 181 |
Magglingen | Jura | 180.5 |
Nesselboden | Jura | 171.7 |
Boltigen | Bernese Oberland | 171.4 |
Les Diablerets | Vaud Alps | 171.1 |
Stiegelschwand | Bernese Oberland | 169.1 |
Tour de Gourze | Lavaux | 158.8 |
Semsales | Fribourg Prealps | 158 |
Château-d’Oex | Vaud Alps | 150.9 |
Jaun | Bernese Oberland | 148.4 |
Gsteig | Bernese Oberland | 147.9 |
For all the stations presented in the table above as well as for other stations located in these regions, the precipitation measured between 30 April and 4 May represents one to one and a half times the normal precipitation for the month of May (norm 1981-2010). This means that already on 4 May, many stations located on the northern side of the Alps had measured more precipitation than usually measured during an entire month of May.
Daily precipitation and daily mean temperature
Between 30 April and 4 May 2015, temperatures on the northern side of the Alps gradually increased with the inflow of warm air from the south-west. Most of the precipitation was spread over three to four days depending on the region, and the largest daily sums were measured in most regions on 1 May.
During the afternoon and night of 30 April, the 0°C isotherm was located around 1800-2200m and the precipitation that started in the evening of 30 April mostly fell as rain in the affected area. The largest rainfall amounts were measured in the Jura mountains (e.g. La Dôle VD, 32.5 mm; Eptingen BL, 31.6 mm), at the foot of the Jura and on the Plateau (e.g. Riedholz-Wallierhof SO, 29.5 mm; St. Urban LU, 29.2 mm; Grenchen SO, 28 mm), as well as in the Prealps of western Switzerland (e.g. Col des Mosses VD, 29.3 mm; Fruence FR, 26.1 mm).
On 1 May, the temperatures increased only very slightly and the 0°C isotherm remained around 1900-2200m altitude. That day, the intensity of the precipitation also increased and very large rainfall amounts were measured in the regions just mentioned (e.g. La Dôle, 99.7 mm; Riedholz-Wallierhof, 109.8 mm; Fruence, 95.9 mm). Even larger daily precipitation sums were measured in the Valais (e.g. Morgins, 114.6 mm; Derborence, 114.4 mm; Emosson, 111.1 mm), a large part of which fell as rain. For all these stations, the precipitation recorded on 1 May already represents more than half of what is usually measured during a whole month of May at those stations (norm 1981-2010).
On 2 and 3 May, the precipitation continued but with lower intensity than on 1 May. Those days, and especially on 3 May, temperatures considerably increased with the passage of a warm front over Switzerland. The 0°C isotherm was shifted by almost 1000m in two days and was located above 2800-3000m on 3 May, causing the precipitation to fall as rain over most of the Alps. This region received the highest precipitation on 2 and 3 May, while slightly lower rainfall was measured in the Jura and on the Plateau. The table below lists the precipitation measured on 2 and 3 May at a few stations located on the northern side of the Alps.
Daily precipitation (in mm) at stations located on the northern side of the Alps for 2 and 3 May 2015. Source: MeteoSwiss
| Station | Region | 2 May | 3 May |
|---|---|---|---|
Boltigen | Bernese Oberland | 37 | 49.1 |
Col des Mosses | Vaud Alps | 40 | 49.4 |
Emosson | Valais | 56.3 | 32.7 |
La Dôle | Jura | 30.1 | 29 |
Morgins | Valais | 41.8 | 53.7 |
Mürren | Bernese Oberland | 39.5 | 43.8 |
Salanfe | Valais | 40.4 | 49.3 |
Tour de Gourze | Plateau | 29.2 | 30 |
On 4 May, the inflow of air towards Switzerland switched to a southerly flow, causing a situation of foehn on the northern side of the Alps and a further increase in temperatures. The precipitation also decreased and low rainfall amounts were measured that day on the northern side of the Alps (maximum 9.7 mm at Riex, VD).
Downloads
RhiresD is the spatial analysis of daily precipitation in Switzerland. The daily precipitation on day D corresponds to the rainfall and snowfall water equivalent accumulated from 06:00 UTC of day D to 06:00 UTC of day D+1. For more information about this data set, see the documentation given below.
TabsD is the spatial analysis of the daily mean air temperature 2m above ground level and is representative of the average from midnight to midnight UTC. For more information about this data set, see the documentation given below.