Service Navigation
Search
The figure below shows the hyetographs for 10 stations measuring hourly precipitation and located in the affected regions that recorded large precipitation amounts between 30 April and 4 May 2015. The hyetographs show more or less similar patterns: at all stations, the precipitation fell in three successive phases, each separated by a few hours.
For most stations, the first precipitation phase was the most intense and lasted the longest. It started during the night of 30 April to 1 May and persisted until 2 May early in the morning. The highest hourly precipitation intensities were measured at the foot of and in the Jura mountains at stations Grenchen (11.3 mm/h) and Nesselboden (9.7 mm/h).
The second precipitation phase started during the afternoon of 2 May until the afternoon of 3 May and was directly followed by the third precipitation phase a few hours later, which lasted until the morning of 4 May. During these two phases, the hourly precipitation intensity was lower than during the first precipitation phase at most stations (< 6 mm/h), except at station Boltigen (Bernese Oberland), at which a maximum of 9.7 mm of precipitation was measured in one hour on 4 May.
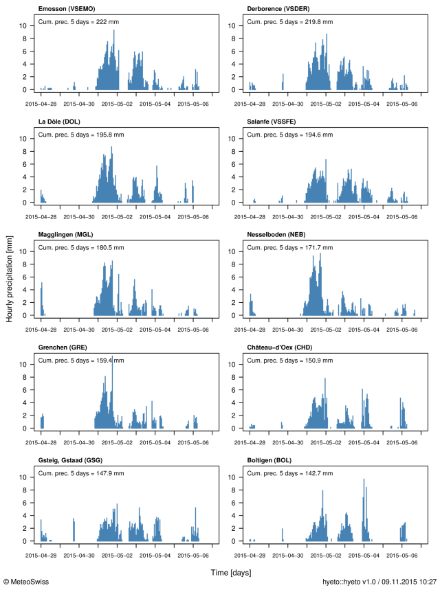
The hyetographs display hourly precipitation starting 2 days before the beginning of the event (28 April 2015) and ending 2 days after the end of the event (6 May 2015). The hourly precipitation [mm] is represented by the vertical blue bars and the date is indicated on the time axis, where each day begins at 00 UTC. The cumulated precipitation over the duration of the event (5 days) is given in the top left corner of the plots and corresponds to the precipitation measured between 30 April 2015, 05:40 UTC and 5 May 2015, 05:40 UTC.
Comparison with other heavy precipitation events
Except for station La Dôle, the stations presented in the hyetograph plots only started measuring hourly precipitation after 2011 and hence not many years of data are available for comparison. Instead, a comparison is done for other stations located in the same region (Adelboden, Montana and Wynau), at which large precipitation amounts were also recorded between 30 April and 4 May 2015 (see infoboxes below).
For all stations, the largest 96-hour precipitation measured during the event is higher than the spring record for the period 1981-2014. While at stations La Dôle, Montana and Adelboden the record is exceeded by about 20 mm, at station Wynau 50 mm more precipitation were measured during the event.
Largest 96-hour precipitation sums measured between 30 April and 4 May 2015 and spring record for the period 1981-2014. Source: MeteosSwiss
| Station | Largest 96-hour precipitation during the event | 96-hour spring record 1981-2014 |
|---|---|---|
La Dôle (Jura) | 195.7 mm | 174.0 mm, April 1983 |
Wynau (Plateau) | 141.8 mm | 90.4 mm, May 1981 |
Adelboden (Bernese Oberland) | 138.8 mm | 118.5 mm, May 1999 |
Montana (Valais) | 133.8 mm | 115.1 mm, March 1988 |
When considering all seasons and a longer time frame, however, larger 96-hour precipitation amounts have been measured in the past at stations La Dôle, Montana and Adelboden, especially in winter, and this event does not figure in the top 10 of the largest 96-hour precipitation sums. For example, other events brought 264.7 mm at station La Dôle (February 1980), 198.4 mm at station Montana (December 1991) and 180.6 mm at station Adelboden (November 1944).
In contrast, at station Wynau this event brought the second largest 96-hour precipitation sum measured at that station since 1978, all seasons considered, the record being 163.4 mm (September 1987).
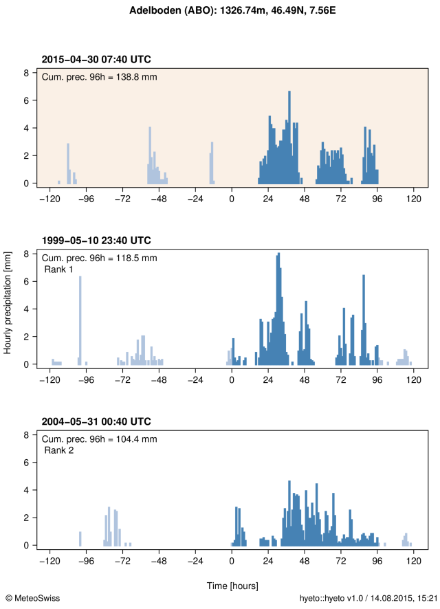
Comparison of the event (beige background) with the two largest 96-hour precipitation sums (white background) that were measured at station Adelboden (Bernese Oberland) in spring (MAM) between 1983 and 2014. The hourly precipitation [mm] is represented by vertical bars: blue during, and grey before and after the 96-hour intervals. The dates and times corresponding to the beginning of the 96-hour intervals are given above the plots and indicated by 0 on the time axis. The rank indicates the ranking of the events compared to other 96-hour precipitation sums at that station.
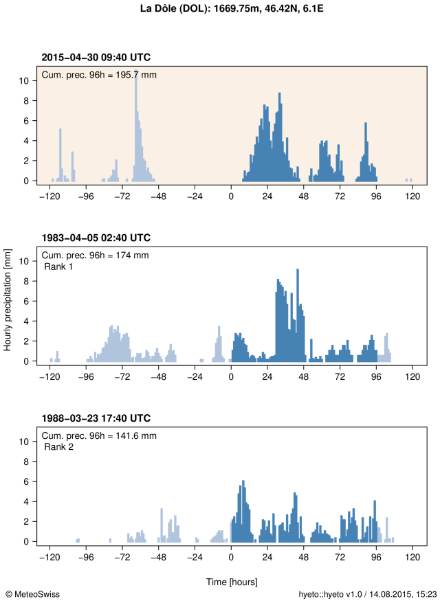
Comparison of the event (beige background) with the two largest 96-hour precipitation sums (white background) that were measured at station La Dôle (Jura) in spring (MAM) between 1981 and 2014. The hourly precipitation [mm] is represented by vertical bars: blue during, and grey before and after the 96-hour intervals. The dates and times corresponding to the beginning of the 96-hour intervals are given above the plots and indicated by 0 on the time axis. The rank indicates the ranking of the events compared to other 96-hour precipitation sums at that station.
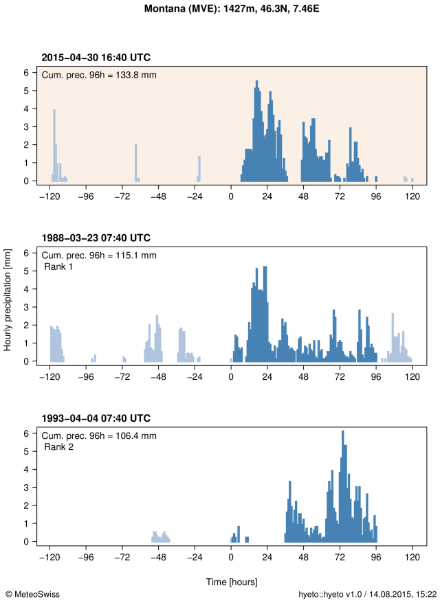
Comparison of the event (beige background) with the two largest 96-hour precipitation sums (white background) that were measured at station Montana (Valais) in spring (MAM) between 1981 and 2014. The hourly precipitation [mm] is represented by vertical bars: blue during, and grey before and after the 96-hour intervals. The dates and times corresponding to the beginning of the 96-hour intervals are given above the plots and indicated by 0 on the time axis. The rank indicates the ranking of the events compared to other 96-hour precipitation sums at that station.
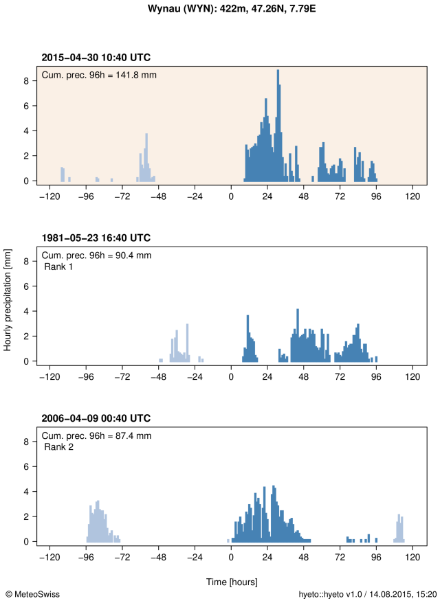
Comparison of the event (beige background) with the two largest 96-hour precipitation sums (white background) that were measured at station Wynau (Plateau) in spring (MAM) between 1981 and 2014. The hourly precipitation [mm] is represented by vertical bars: blue during, and grey before and after the 96-hour intervals. The dates and times corresponding to the beginning of the 96-hour intervals are given above the plots and indicated by 0 on the time axis. The rank indicates the ranking of the events compared to other 96-hour precipitation sums at that station.
Moving sums of hourly precipitation cumulated over a duration interval of 96 hours are used in order to determine both the largest 96-hour precipitation sums at the given stations and their ranking compared to other precipitation sums of same duration for the same season (MAM). A large 96-hour precipitation sum does not always result from one long-lasting precipitation event, but can also result from two successive precipitation events separated by a certain amount of hours. Note that the starting time of the duration interval over which the cumulated precipitation is highest can differ from one station to another.
Automatic stations measuring hourly precipitation were used to produce the hyetographs presented above. These stations are not always located, however, where the highest precipitation falls, and the daily sums are sometimes lower than those measured at other stations in the affected area that measure daily precipitation only.
Precipitation sum [mm] over 1, 4 and 5 day(s) for stations Morgins (MGI, Valais), Col des Mosses (CDM, Vaud Alps), Riedholz-Wallierhof (WHF, Jura foot) and Boltigen (BOT, Bernese Oberland). The sum is always calculated from 05:40 UTC of a given day to 05:40 UTC of the following day. Source: MeteoSwiss
| Date | MGI | CDM | WHF | BOT |
|---|---|---|---|---|
30.04.2015 | 20.6 | 29.3 | 29.5 | 6.4 |
01.05.2015 | 114.6 | 81 | 109.8 | 76.3 |
02.05.2015 | 41.8 | 40 | 27.2 | 37 |
03.05.2015 | 53.7 | 49.4 | 18.7 | 49.1 |
04.05.2015 | 9.5 | 5.7 | 7.3 | 2.6 |
4-day sum (30.04-03.05.2015) | 230.7 | 199.7 | 185.2 | 168.8 |
5-day sum (30.04-04.05.2015) | 240.2 | 205.4 | 192.5 | 171.4 |
For these four stations, the precipitation event of 30 April to 4 May brought the largest 4-day precipitation sum ever measured in spring since 1975. However, larger precipitation amounts have been measured at stations Col des Mosses and Boltigen since 1975 during other seasons, for example in February 1990 (respectively 367 mm and 219.2 mm).
