Service Navigation
Search
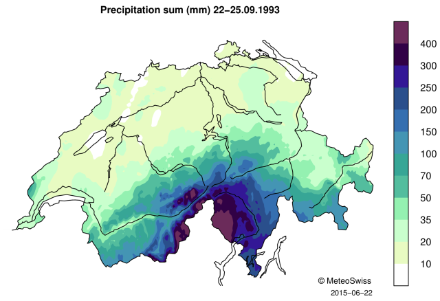
4-day precipitation sum for 22-25 September 1993
During this event, precipitation mainly fell over the Alpine crest and on the southern side of the Alps, with maximum intensity over north-western Ticino and the Upper Valais.
4-day precipitation (in mm) for 22-25 September 1993 for stations located in Ticino and in the Upper Valais. Source: MeteoSwiss
| Station | Region | 4-day precipitation |
|---|---|---|
Mosogno | Ticino | 544.3 |
Càmedo | Ticino | 543.8 |
Cevio | Ticino | 478.6 |
Bosco-Gurin | Ticino | 445.1 |
Binn | Upper Valais | 381.4 |
Simplon-Dorf | Upper Valais | 374.8 |
This represents for Ticino up to twice and for the Upper Valais up to three times the average amount of precipitation usually measured in September in those regions (norm 1981-2010).
Daily precipitation
This precipitation event was divided in two phases. The first phase, marked by orographic precipitation on 22-23 September, brought high precipitation sums over the southern side of the Alps, in particular over Ticino (see table below). Lower but still high precipitation amounts were also measured in the Upper Valais.
During the second precipitation phase marked by frontal precipitation on 24 September, the precipitation maximum shifted towards the Upper Valais, however high precipitation was still measured in Ticino. On 25 September, precipitation had altogether decreased over the southern Alps, but some high daily amounts were still measured at some stations (e.g. Cevio, 105.8 mm).
Daily precipitation (in mm) between 22 and 25 September 1993 for stations located in Ticino (Bosco/Gurin to Mosogno) and in the Upper Valais (Binn and Simplon-Dorf). Source: MeteoSwiss
| Station | 22.9.93 | 23.9.93 | 24.9.93 | 25.9.93 |
|---|---|---|---|---|
Bosco/Gurin | 117.3 | 132.7 | 176.9 | 18.2 |
Càmedo | 192.2 | 162.3 | 169.1 | 20.2 |
Cevio | 115.1 | 111.9 | 145.8 | 105.8 |
Mosogno | 254.3 | 137.2 | 132 | 20.8 |
Binn | 83.9 | 110 | 161.5 | 26 |
Simplon-Dorf | 73.6 | 110.2 | 182.2 | 8.8 |
Daily mean temperature
The particular severity of the event was due not only to the amount of precipitation, but also to its type. As warm air was advected from the south, temperatures during the event were relatively high and the 0° C isotherm was located at a high altitude (above 3000m). This resulted in the precipitation falling as rain instead of snow.
Downloads
RhiresD is the spatial analysis of daily precipitation in Switzerland. The daily precipitation on day D corresponds to the rainfall and snowfall water equivalent accumulated from 06:00 UTC of day D to 06:00 UTC of day D+1. For more information about this data set, see the documentation given below.
TabsD is the spatial analysis of the daily mean air temperature 2m above ground level and is representative of the average from midnight to midnight UTC. For more information about this data set, see the documentation given below.