Service Navigation
Search
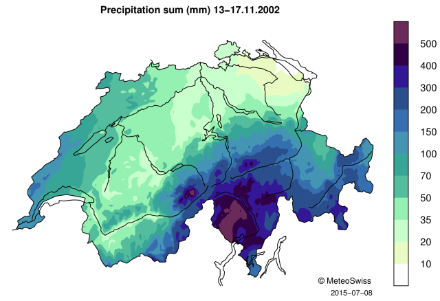
5-day precipitation sum for 13-17 November 2002
During this event, extremely large amounts of precipitation fell over the central Alpine north slope, in the Grisons and in Ticino. The highest 5-day precipitation was measured in Ticino at station Mosogno (637.1 mm) and represents more than three times more precipitation than the amounts recorded on average in November at that station (norm 1981-2010). In comparison with other stations in Switzerland, this amount represents as much as the average yearly precipitation for stations Sion and Zermatt (norm 1981-2010).
For most of the other stations located within the affected area, the 5-day precipitation measured between 13 and 17 November 2002 was also very high and corresponds to two to three times the amounts recorded on average in November.
5-day precipitation (in mm) for 13-17 November 2002 for stations located in Ticino, in the Grisons and on the central Alpine north slope. Source: MeteoSwiss
| Station | Region | 5-day precipitation |
|---|---|---|
Mosogno | Ticino | 637.1 |
Cevio | Ticino | 542 |
Magadino/Cadenazzo | Ticino | 500 |
Piotta | Ticino | 402.3 |
S. Bernardino | South Grisons | 393.1 |
Berninapass | South Grisons | 337.4 |
Soglio | South Grisons | 320.6 |
Göschenen | Central Alpine north slope | 315.2 |
Disentis/Sedrun | North-west Grisons | 284.2 |
Göscheneralp | Central Alpine north slope | 279.7 |
Andermatt | Central Alpine north slope | 270.1 |
Daily precipitation
What made this event particularly devastating is the persistence of extremely heavy precipitation between 14 and 16 November 2002 over the central Alpine north slope, the Grisons and Ticino. Each day, some stations in those regions recorded as much precipitation as is usually recorded during the entire month of November. The table below indicates the daily precipitation for 14-16 November, as well as the average November precipitation (norm 1981-2010) for different stations located in the affected region.
Daily precipitation (in mm) measured between 14 and 16 November 2002 and average November precipitation (norm 1981-2010) for stations in Ticino (Cevio to Piotta), in the southern Grisons (Berninapass to Soglio), and on the central Alpine north slope and in the north-west of the Grisons (Andermatt to Göscheneralp). Source: MeteoSwiss
| Station | 14 Nov | 15 Nov | 16 Nov | Norm 1981-2010 |
|---|---|---|---|---|
| Cevio | 152.5 | 185 | 156.5 | 166 |
| Magadino/Cadenazzo | 203.7 | 165.4 | 114.7 | 173 |
| Mosogno | 157.4 | 209.4 | 247.8 | 192 |
Piotta | 112.3 | 145.6 | 130.4 | 130 |
Berninapass | 92 | 114.7 | 100 | 187 |
Grono | 100 | 106.1 | 103.3 | 127 |
S. Bernardino | 135.9 | 122.6 | 109.2 | 143 |
Soglio | 111.2 | 101.8 | 95.7 | 130 |
Andermatt | 79.3 | 88.3 | 101.9 | 144 |
Disentis/Sedrun | 79.4 | 99.1 | 102.9 | 99 |
Göschenen | 87 | 125.2 | 102 | 130 |
Göscheneralp | 68.5 | 100.3 | 110.5 | 140 |
High rainfall was also measured on 14 November in the western part of Switzerland, which had consequences in the region of Geneva. Since in that case only the 24-hour precipitation was relevant, it is presented as another event for which the description can be found here: 14-15 November 2002.
Daily mean temperature
During the event, the 0°C isotherm was located around 2200-2600m or even higher and the precipitation fell as snow only in the elevated regions, while it fell as rain in the regions located at lower altitude, in the valleys and in most of Ticino.
Downloads
RhiresD is the spatial analysis of daily precipitation in Switzerland. The daily precipitation on day D corresponds to the rainfall and snowfall water equivalent accumulated from 06:00 UTC of day D to 06:00 UTC of day D+1. For more information about this data set, see the documentation given below.
TabsD is the spatial analysis of the daily mean air temperature 2m above ground level and is representative of the average from midnight to midnight UTC. For more information about this data set, see the documentation given below.