Service Navigation
Search
Why are climate scenarios necessary?
Climate change is real, as numerous observations in Switzerland and around the world show. Climate change has already triggered noticeable changes and presents us with challenges. These include extreme heat events, heavier rainfall, drier summers and winters with less snow. The Climate CH2025 scenarios provide a scientifically sound basis for quantifying the possible consequences of climate change for Switzerland and for planning climate mitigation and adaptation measures.
Basis of the Climate CH2025 scenarios
A large number of climate simulations are used to estimate future climate in Switzerland. These climate projections are based on internationally agreed scenarios of how the world might develop in future, for example, in terms of energy consumption, population growth and technological development (pathways). Assumptions about socio-economic development are described using Shared Socioeconomic Pathways (SSPs). A specific range of possible greenhouse gas emissions is derived from each SSP. Experts refer to these ranges as Representative Concentration Pathways (RCPs). The RCPs make it possible to estimate the effects of future socio-economic developments and associated greenhouse gas emissions, on the future climate.

Climate simulations use SSP-RCP scenarios to create climate scenarios. Global climate models provide comprehensive information on possible climate conditions around the world. However, they are not accurate enough to make statements about individual regions. The EURO-CORDEX initiative (Coordinated Regional Climate Downscaling Experiment – European Domain) of the World Climate Research Programme, therefore refines global climate simulations for Europe using regional climate models. These use a grid size of approximately 12 kilometres. Compared with previous scenarios, the Klima CH2025 model results have been expanded and updated to include findings from the latest Intergovernmental Panel on Climate Change (IPCC) assessment report. Developing the Klima CH2025 highlights the vital role of international cooperation, especially within Europe. Reliable climate scenarios for Switzerland are only possible through shared data, expertise, and modelling.
Statistical methods are used to further refine results of regional climate simulations. Data from long-term, reliable measurements are used for this purpose; the quality and continuity of which are ensured by the National Climate Observation Programme (GCOS-CH). This enables statements to be made for specific meteorological measurement locations and comprehensive maps with a resolution of one kilometre – for example, for both temperature and precipitation. The high-resolution datasets can be obtained here.
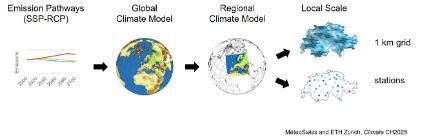
Results of these analyses are supplemented with information from high-resolution, temporally and spatially detailed climate models that allow for convection. These models depict local processes, such as heavy precipitation, thunderstorms and hail in a much more realistic way, thereby contributing to a better understanding of the processes and providing new foundations for practical application. Due to the high computational effort involved, climate simulations of these models are currently only calculated for short periods of time, but their importance will increase in the future.
What are Global Warming Levels (GWLs)?
The climate scenarios show the possible future of the Swiss climate for different global warming levels (GWLs). They show the climate conditions that will prevail in Switzerland once the global average temperature has risen to 1.5 degrees Celsius, 2 degrees Celsius or 3 degrees Celsius above the pre-industrial temperature level of 1871–1900. The approach follows the methodology of the Sixth Assessment Report of the Intergovernmental Panel on Climate Change (IPCC) and allows the results to be linked to the climate targets in the Paris Agreement.

Global warming levels make it possible to show the effects of global temperature rise on Swiss climate, independently of emissions scenarios and therefore independently of the rate of global warming. The rate and thus also the point in time at which a certain warming level is reached depends fundamentally on the respective emissions scenario used.
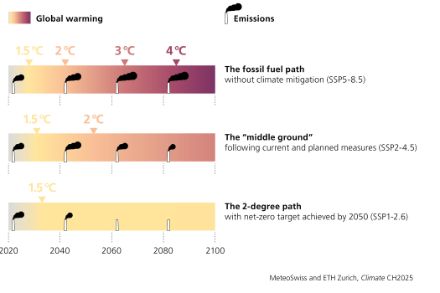
A 1.5-degree world is practically unavoidable due to past and current global greenhouse gas emissions and is expected to be reached in the next 5 to 15 years. A 2-degree world would be reached at around 2050 with current and planned climate mitigation (SSP2-4.5) or at around 2040 if we continue to rely on using fossil fuels without implementing further climate mitigation measures (SSP5-8.5). A 3-degree world would become reality around 2065 if we continue to rely on using fossil fuels without implementing climate mitigation measures (SSP5-8.5). Based on the measures currently planned for global emissions reduction, the world is heading for a temperature rise of around 3 degrees Celsius by the end of the century (sources: IPCC, Climate Action Tracker (as of 2025)).
A 3-degree world refers to a state in which the global average temperature has risen by 3 degrees Celsius since 1871–1900. By the reference period 1991–2020, the global average temperature had already increased by 0.9 degrees Celsius. The results of the Swiss climate scenarios therefore describe climatic changes that would follow from an additional warming of 2.1 degrees Celsius, which, when referenced to 1991–2020, represents the remaining increase leading to a 3-degree world.
How are the results interpreted?
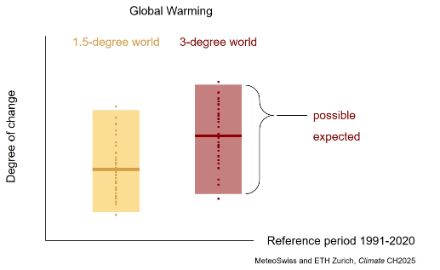
Climate models differ in the way they represent certain processes in the atmosphere, on the land surface, or in the oceans. As a result, different models produce slightly different results. In order to assess the possible effects of global warming on the climate in Switzerland as comprehensively as possible, numerous simulations are carried out and analyzed using different models. The resulting range of results shows the possible scope of future developments. This range can be clearly visualized by displaying percentile ranges.
Half of the projection results for a GWL (colored dots in the graph below) are above or below the median (thick horizontal line within the colored box in the graph). This corresponds to the "medium estimate" and is therefore referred to as the "expected value" in the climate scenarios. The "upper estimate" (95th percentile) corresponds to the upper edge of the colored box, and the "lower estimate" (5th percentile) to the lower edge. All values between the upper and lower estimates are referred to as "possible" in Climate CH2025. Since the climate model ensemble can only capture part of the actual possible range of variation, it is assumed that the effective range is greater. The probability that the real values will lie within the "possible" range is estimated at two-thirds. The individual points represent individual model simulations. These points are not visible in our products.
Available reports, data, and graphics from the Swiss climate scenarios
Various reports, data, and graphics were produced as part of the Climate CH2025 project. Here you will find an overview of the products of the current and previous climate scenarios.
In addition, a subselection of the climate model simulations from Climate CH2025 is currently being developed. The target group for the Climate CH2025 Ensemble Subselection comprises individuals who aim to investigate the potential sectoral impacts of climate change using climate impact models.