Service Navigation
Search
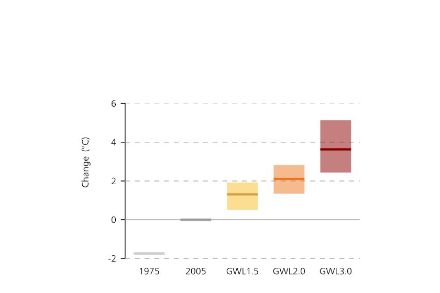
The Climate CH2025 web atlas offers a collection of data and graphics on future climate development in Switzerland. The web atlas displays thousands of interactive graphics on various climate indicators and can be viewed for the observation period (reference period 1991-2020) and for the three global warming levels (GWL1.5, GWL2.0, GWL3.0). Both maps and diagrams are available. In addition, for the two basic variables temperature and precipitation, a type of graphic is offered that makes it possible to view the change signals in the context of three future time periods (2040, 2050, and 2060).
All graphics are available in four languages and can be downloaded together with the corresponding data.


The graphics and data of the Climate CH2025 web atlas are also listed on the following page. This page provides the option to add applications to your favourites.
MeteoSwiss and ETH Zurich, Climate CH2025
The graphics and data of the Climate CH2025 web atlas are provided under the CC BY 4.0 licence [externer Link]. This includes the right to share (copy and redistribute in any medium or format) and adapt (remix, transform, and build upon for any purpose, even commercially) the graphics and data under the condition that they are correctly cited (see above). Please note also that all material is provided without any warranties and guarantees.
Overview of the Climate CH2025 climate indicators
This document provides an overview of all climate indicators and their definitions used in the Climate CH2025 scenarios. This is intended to avoid confusion and inconsistencies and to provide a comprehensive overview.