Service Navigation
Search
Spatial distribution of heavy precipitation
The mean of the largest precipitation amounts each year over a given period provides some information on the geographical distribution of heavy precipitation. It is shown in the following figure in mm for 1 and 5 day precipitation (period 1961-2014) and for 1 hour and 10 minute precipitation (period 1981-2014).
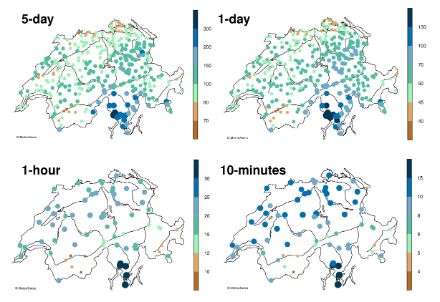
For all precipitation accumulation durations, the Ticino stands out as an area affected by very heavy precipitation. At the other end of the scale, the largest amounts reached in the inner Alpine valleys are very modest, especially in the Rhone and the Inn valleys.
North of the Rhone and Rhine valleys, the spatial distribution of precipitation depends on the duration of accumulation. For durations exceeding a day, the northern Alpine rim (Prealps) and the Jura mountains experience heavier precipitation than the Plateau, thus highlighting topographical features. This pattern reflects the frequency of lightning strikes, and is consistent with the fact that thunderstorms are likely to contribute substantially to 1 day, but also to 5 day precipitation maxima.
At very short durations, on the other hand, the signature of the northern Alps is not visible: very heavy hourly or 10 minute precipitation does not depend on topography. (Note that this is not the case for average hourly or 10 minute precipitation, which displays the largest values over the northern Alpine rim and the Jura mountains, not shown). The reasons for this are unclear, but it is possible that while the generation of thunderstorms is more frequent along the northern Alpine rim than in the plain below, they are transported northwards or northeastwards by the large-scale flow and reach full maturity over the Plateau.
Seasonal variations
The following slide-show displays the percentage of years in which the yearly maxima falls in a given season (winter: December-January-February; spring: March-April-May; summer: June-July-August; autumn: September-October-November).
The seasonal distribution of heavy precipitation for durations above one day puts in evidence the processes involved, and the interaction of the Alps with large-scale circulation in the different seasons. The Ticino, subject to the heaviest precipitation in Switzerland, seems to experience most of its yearly maxima in autumn. This corresponds to a situation of southerly flow, when moist air picked up over the Mediterranean impinges upon the southern flank of the Alps. Over the northern Alpine rim, the vast majority of yearly maxima occur in summer, can usually be attributed to thunderstorms in connection with westerly flow, but also with northwesterly flow and the persistent transport of moisture towards the Alps.
For short precipitation durations, the yearly maximum hardly ever occurs in winter in most of Switzerland, except, occasionally, in the inner Alpine valleys. As thunderstorms produce the heaviest short-term precipitation, it is no surprise that most hourly or 10 minute yearly maxima are recorded in the summer months.
Related publications
Weiterführende Literatur
- Frei C, Schär C (1998) A precipitation climatology of the Alps from high resolution rain-gauge observations. Int J Climatol 18:873–900
- Frei C, Schmidli J (2006) Das Niederschlagsklima der Alpen: Wo sich Extreme nahe kommen. promet 32:61–67
- Isotta et al. 2013. The climate of daily precipitation in the Alps: development and analysis of a high-resolution grid dataset from pan-Alpine rain-gauge data. International Journal of Climatology, Vol. 34, Issue 5, pp 1657–1675.
- Meteorologische Ereignisanalyse des Hochwassers 8. bis 9. August 2007. Arbeitsbericht MeteoSchweiz Nr. 222 (PDF, 32 Seiten, 2,8 MB, Deutsch)
- Möglichkeit und Grenzen der Niederschlagsanalyse zum Hochwasser 2005. Arbeitsbericht MeteoSchweiz Nr. 221 (PFD, 23 Seiten, 1,7 MB, Deutsch)
- Eine Länderübergreifende Niederschlagsanalyse zum August Hochwasser 2005, Ergänzung zum Arbeitsbericht 211. Arbeitsbericht MeteoSchweiz Nr. 213 (PDF, 12 Seiten, 2,9 MB, Deutsch).
- Starkniederschlagsereignis August 2005. Arbeitsbericht MeteoSchweiz Nr. 211 (PDF, 64 Seiten, 6,5 MB, Deutsch)
- Bezzola G.R. und Hegg C. (Ed.) 2007. Ereignisanalyse Hochwasser 2005, Teil 1 - Prozesse, Schäden und erste Einordnung. Bundesamt für Umwelt BAFU, Eidgenössische Forschungsanstalt WSL, Umwelt-Wissen Nr. 0707. 215pp.
- Bezzola G.R., Ruf W. (Ed.), 2009. Ereignisanalyse Hochwasser August 2007. Analyse der Meteo- und Abflussvorhersagen; vertiefte Analyse der Hochwasserregulierung der Jurarandgewässer. Umwelt-Wissen Nr. 0927. Bundesamt für Umwelt, Bern. 209pp.
- OcCC, 2003, Extremereignisse und Klimaänderung , insb. Kapitel 2.5 Starkniederschläge