Service Navigation
Search
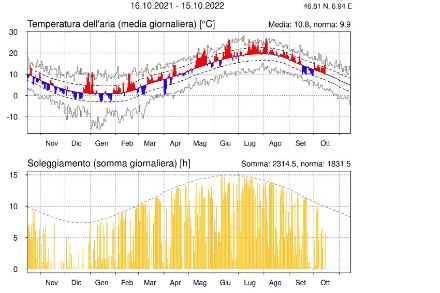
The graphs below show daily or monthly values for temperature, sunshine duration and precipitation in comparison to the normal period of 1991–2020 for the stations in the Swiss Climate Network . For temperature, the daily or monthly mean is given, and for sunshine duration and precipitati on, the absolute daily or monthly sum.
Deviations from the normal annual cycle occur as a result of short-term fluctuations over several days or weeks. Climate change is also causing the temperature to deviate from the average annual cycle.
The graphs provide an overview of the weather in past years and facilitate an understanding of how the climate has changed. MeteoSwiss uses the graphs for customer enquiries and publishes them in the monthly bulletins. For climate and climate impact research, the graphs are helpful for things such as identifying the duration and intensity of cold and hot spells in the past.
Typical annual trends
The angle of the Earth’s axis relative to its orbit around the Sun means that the Earth is irradiated from different angles at different points of the annual cycle. Depending on the distance from the equator, this results in greater or lesser differences between the seasons. In Switzerland, there are distinct seasonal differences. The length of the day and the maximum possible duration of sunshine vary from location to location, which means that the temperature also fluctuates throughout the course of the year. In the case of precipitation, the key factors are the prevailing weather situations and the fact that the Alps act as a climatic barrier.
A general explanation of the typical annual patterns of temperature, precipitation and sunshine duration for Switzerland is given below.
Temperature
The lowest temperatures usually occur between December and February in all parts of Switzerland. At most measurement sites, January is generally the coldest month of the year. The greatest variability in temperature is found in winter. This applies to the daily values as well as to the fluctuations from year to year in relation to the monthly mean temperatures from January to February. The reason for this is the variable winter weather.
The highest temperatures in Switzerland are usually recorded between June and August, while July is generally the warmest month of the year. In July and August, daily average temperatures of 25°C or more are possible at lower altitudes.
Sunshine duration
The annual variation in sunshine duration is influenced not only by solar radiation but also by cloud cover, which can shorten the sunshine duration. In winter, fog or low stratus are common in the Swiss plateau. The sunshine duration is therefore particularly short in that region during the cold season. The other regions of Switzerland are less affected by this phenomenon.
The most hours of sunshine in Switzerland usually occur between June and July. The shorter days already start to become noticeable in August. Spring and thunderstorm clouds often form along the main ridge of the Alps during the summer months, which reduces the amount of sunshine there. The dry valleys in the inner Alps are sunny all year round.
Precipitation
Precipitation also follows a distinct annual cycle. In many places in Switzerland, more precipitation falls in the summer than in the winter. The reason for this is that warm air is able to absorb more water. This is conducive to the formation of thunderstorms and leads to heavy rainfall. There are regional differences, however: On the northern side of the Alps, the largest amounts of precipitation normally fall in the summer months, whereas on the southern side of the Alps, the peaks in precipitation tend to occur in spring and autumn. However, the monthly deviations from average values can be so large across Switzerland that the maximum and minimum monthly precipitation amounts are recorded in different months depending on the year in question.
Annual cycle of the measured variables for each postcode
The Climate Monitor shows the temperature, precipitation and sunshine duration throughout the annual cycle over the past 24 months in comparison to the normal period of 1991–2020 for postcodes in Switzerland.